ดาวน์โหลดงานนำเสนอ
งานนำเสนอกำลังจะดาวน์โหลด โปรดรอ

1
Chapter 6 Inventory Management
Aj-Kulachatr C. Na Ayudhya Naresuan University Payao Campus Semester 1/50

2
Inventory Management การบริหารสินค้าคงคลัง
การเก็บวัตถุดิบ ชิ้นส่วนการผลิต สินค้าระหว่างผลิตและสินค้าสำเร็จรูปไว้ในการผลิตเป็นเรื่องจำเป็นสำหรับธุรกิจโดยทั่วไป แต่ต้องมีปริมาณที่เหมาะสมต่อการใช้และไม่ควรเก็บไว้มากเกินไป เพราะจะเกิดต้นทุนจม (Sunk Cost) และหากมีน้อยเกินไปก็อาจเกิดต้นทุนเนื่องจากสินค้าขาดมือ (Shortage Cost) ในปัจจุบัน ธุรกิจส่วนใหญ่หันมาใช้เทคโนโลยีด้านการจัดการสินค้าคงคลังเพื่อลดต้นทุนในองค์กรกันมาก ตั้งแต่การใช้คอมพิวเตอร์เข้ามาจัดการสินค้า ใช้บาร์โค้ด ใช้ซอฟท์แวร์ ช่วยควบคุมต่างๆ เพื่อให้สินค้าคงคลังมีปริมาณที่เหมาะสมและเกิดการประหยัดในการสั่งซื้อ (Economic Quantity Order)
 และหากมีน้อยเกินไปก็อาจเกิดต้นทุนเนื่องจากสินค้าขาดมือ (Shortage Cost) ในปัจจุบัน ธุรกิจส่วนใหญ่หันมาใช้เทคโนโลยีด้านการจัดการสินค้าคงคลังเพื่อลดต้นทุนในองค์กรกันมาก ตั้งแต่การใช้คอมพิวเตอร์เข้ามาจัดการสินค้า ใช้บาร์โค้ด ใช้ซอฟท์แวร์ ช่วยควบคุมต่างๆ เพื่อให้สินค้าคงคลังมีปริมาณที่เหมาะสมและเกิดการประหยัดในการสั่งซื้อ (Economic Quantity Order)")
3
Inventory Management ประเภทของสินค้าคงคลัง
วัตถุดิบ (Raw Material) สินค้าระหว่างผลิต (Work in Process) วัสดุซ่อมบำรุง (Maintenance/Repair/Operating Supplies) สินค้าสำเร็จรูป (Finished Goods) WIP Raw Material Finish Goods
 สินค้าระหว่างผลิต (Work in Process) วัสดุซ่อมบำรุง (Maintenance/Repair/Operating Supplies) สินค้าสำเร็จรูป (Finished Goods) WIP. Raw Material. Finish Goods.")
4
Basic Decision for Inventory Management
Financial Policy High Return Minimum stock for reduction of sunk cost Avoid risk of stock out cost Production & Selling Policy Available of goods for produce and sales Maintain and keeping the stock Quantities of goods are correct Available of good and not to be damaged

5
Cost of Inventory Item cost or Material cost
Stock-out cost (Opportunity Cost) Ordering cost in case of purchasing Set up cost in case of self-producing Carrying cost or Holding cost Stock keeping area , Tax , wages , insurance , interest , opportunity cost , …etc.
 Ordering cost in case of purchasing. Set up cost in case of self-producing. Carrying cost or Holding cost. Stock keeping area , Tax , wages , insurance , interest , opportunity cost , …etc.")
6
Economic Order Quantity ;EOQ
Discovery by F.W.Harris on the hypothesis as below Ordering cost or Set Up cost ต้นทุนนี้แปรผกผันกับปริมาณ คือ “ถ้าสั่งซื้อหรือสั่งผลิตคราวละมากๆ ต้นทุนสั่งจะต่ำ” Carrying cost or Holding cost ต้นทุนนี้แปรผันตรงกับปริมาณ คือ “ถ้าสั่งซื้อหรือสั่งผลิตคราวละมากๆ ต้นทุนเก็บจะสูง” Shortage cost or opportunity cost “ถ้าไม่เก็บสินค้าไว้เลยหรือเสี่ยงต่อการไม่มีสินค้าไว้เผื่อขาดแคลนจะเกิดต้นทุนสินค้าขาดมือ”

7
Inventory Model (EOQ Model)
ค่าใช้จ่ายรวมในการมีสินค้าตลอดปี (Total Cost of Inventory) = ค่าใช้จ่ายในการสั่งซื้อ (Ordering Cost) + ค่าใช้จ่ายในการเก็บรักษาสินค้า (Holding Cost) Ordering Cost Demand (D) Order Quantity (Q) Set up cost (S) Ordering cost (O) Holding Cost Item cost (C) Interest (i) Inventory cost (I) or or i x C = I
 = ค่าใช้จ่ายในการสั่งซื้อ (Ordering Cost) + ค่าใช้จ่ายในการเก็บรักษาสินค้า (Holding Cost) Ordering Cost. Demand (D) Order Quantity (Q) Set up cost (S) Ordering cost (O) Holding Cost. Item cost (C) Interest (i) Inventory cost (I) or. or. i x C = I.")
8
ข้อกำหนดพื้นฐานของการใช้ตัวแบบ EOQ
การควบคุมสินค้าคงเหลือมีจุดเดียวเท่านั้น เช่น ในโรงเก็บสินค้า ความต้องการสินค้า (Demand) มีค่าคงที่ตลอดเวลา ห้ามเกิดสภาพการขาดแคลนสินค้าคงเหลือ (No-shortage) ระยะเวลาในการนำส่งสินค้า (Lead-time) คงที่ ต้นทุนในการสั่งซื้อและเก็บรักษาสินค้าคงที่ ราคาต่อหน่วยสินค้าต้องมีค่าเท่ากันไม่ว่าจะสั่งปริมาณเท่าใด ใช้ได้กับสินค้าครั้งละ 1 ชนิด ในการนำส่งสินค้าให้ส่งครั้งเดียวครบจำนวนห้ามทะยอยส่งมอบ
 มีค่าคงที่ตลอดเวลา. ห้ามเกิดสภาพการขาดแคลนสินค้าคงเหลือ (No-shortage) ระยะเวลาในการนำส่งสินค้า (Lead-time) คงที่ ต้นทุนในการสั่งซื้อและเก็บรักษาสินค้าคงที่ ราคาต่อหน่วยสินค้าต้องมีค่าเท่ากันไม่ว่าจะสั่งปริมาณเท่าใด. ใช้ได้กับสินค้าครั้งละ 1 ชนิด. ในการนำส่งสินค้าให้ส่งครั้งเดียวครบจำนวนห้ามทะยอยส่งมอบ.")
9
ความสัมพันธ์ของปริมาณสินค้าคงเหลือเมื่อเทียบกับเวลา
Quantity R = Reorder Point L = Lead Time Q = Order Quantity Q R Reorder Point Time Reorder Time L Receiving Time

10
Inventory Model (EOQ Model)
Total Cost = Ordering Cost + Holding Cost Derivative 1st Order of TC

11
EOQ Model Order by purchasing Order by producing

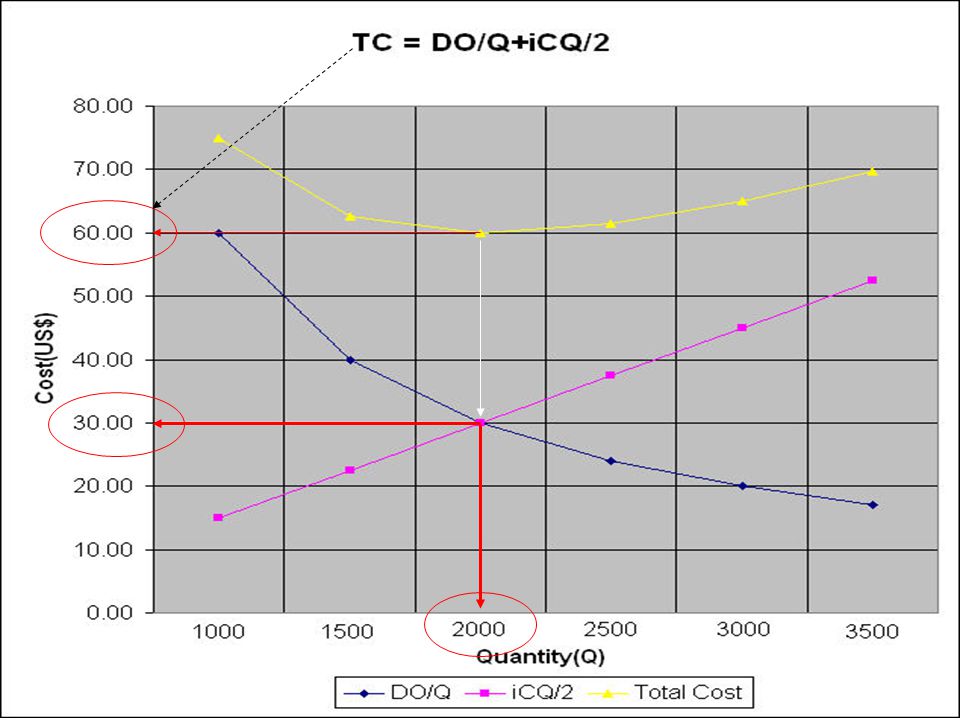
12
Example 1 The company has demand of raw material for producing 15,000 items per year , holding cost of production is 20% of it’s price and 4$ of ordering per time. If unit cost is 0.15$ ,determine the EOQ and TC (please use excel for examine) Q (Items) DO/Q iCQ/2 Total Cost 1,000 60.00 15.00 75.00 1,500 40.00 22.50 62.50 2,000 30.00 2,500 24.00 37.50 61.50 3,000 20.00 45.00 65.00 3,500 17.14 52.50 69.64
 Q (Items) DO/Q. iCQ/2. Total Cost. 1, , , , , ,")
13
การใช้ EOQ Model ตามสมการ

15
Reorder Point จุดสั่งซื้อเพิ่ม : การบริหารสินค้าคงคลังจะต้องมีการสั่งสินค้าเพื่อเพิ่มเติมในสต็อค โดยจุดนี้เป็นจุดที่มีปริมาณสินค้าคงเหลืออยู่ในคลังสินค้า ณ วันที่สั่งซื้อเพิ่ม จุดสั่งซื้อเพิ่ม คำนวณได้จากสูตรต่อไปนี้ RP = Reorder point L = Lead Time d = Usage of goods / Day From Example 1 if this plant work only 300 day / year , the lead time in 5 day of transportation ,please examine Reorder point. Demand = 15,000 / year So, Usage / Day = 15,000 / 300 = 50 Units RP = 50 x 5 = 250 Units (Try it with Excel QM & QMWin)
")
16
Exercise 1 Set up cost of production is 10 $ per time and holding cost is 2$ per item , If Unit cost of production is 10$ and Demand of material per year is 1,000 item ,examine the value of EOQ and the others expenses and time to order D = 1000 , S = 10$ , I = 2$ , C = 10$ EOQ = 2 x 1000 x 10 / 2 = 100 TC = (1000 x 10 / 100) + (2 x 100)/2 = = 200
 + (2 x 100)/2 = = 200.")
17
Exercise 2 D = 1200x12 = 14,400 , O = 5$ , i = 12% , C = 20$
One of purchasing order is 5$ per each , the production holding material cost is 12% of unit cost that is 20$/item , If demand is 1,200 unit / month , please determine EOQ and the others expenses with time to order Lead time = 3 days and working 360 days/year D = 1200x12 = 14,400 , O = 5$ , i = 12% , C = 20$ EOQ = 2 x x 5 / 12%x20 = = 245 TC = (14400 x 5 / 245) + (12% x 20x245)/2 =
 + (12% x 20x245)/2. =")
18
ABC Theory การจัดการสินค้าคงคลังแบบ ABC คือ การจัดกลุ่มสินค้าให้มีความสำคัญตามมูลค่าและปริมาณของสินค้า ในทางปฏิบัติจะพบเสมอว่า สินค้าที่มีปริมาณมากมักมีมูลค่าไม่สูง ในทางตรงกันข้ามสินค้าที่มีมูลค่าสูงจะมีปริมาณไม่มาก ซึ่งแบ่งได้เป็น 3 Class คือ สินค้ากลุ่ม A เป็นกลุ่มที่มีมูลค่าสูงถึง 80% ของมูลค่าสินค้าทั้งหมดในคลังสินค้าแต่มีปริมาณไม่เกิน 20% ของจำนวนรายการทั้งหมด สินค้ากลุ่ม B เป็นกลุ่มที่มีมูลค่าประมาณ 15% ของมูลค่าสินค้าทั้งหมด แต่มีปริมาณในคลังประมาณ 30% ของจำนวนทั้งหมด สินค้ากลุ่ม C เป็นกลุ่มที่มีมูลค่าน้อยที่สุด ประมาณ 5% ของมูลค่าสินค้าทั้งหมด แต่มีปริมาณสูงเกิน 50% ของจำนวนรายการทั้งหมด

19
ABC Diagram (Law of Significant few)
100 C 5% B 15% % of Valuable (%Dollar) A 80% 50 15-20% 25-30% 50-60% % of Items 20 50 100
 A 80% % 25-30% 50-60% % of Items")
20
Example2 Items Usage / Year Unit Price Value % 1 5,000 1.50 7,500 2
1,500 8.00 12,000 3 10,000 10.50 105,000 4 6,000 2.00 5 0.50 3,750 6 13.60 81,600 7 0.75 8 4,500 1.25 5,625 9 7,000 2.50 17,500 10 3,000 Item A=20%,B=30% Total 100.0%

21
Exercise3 Items Usage / Year Unit Price Value % 1 15000 0.2 2 14000
3.0 3 1500 4 55000 0.1 5 2000 6 110000 7 7500 8 40000 9 3000 10 4000 Item A=15%,B=25% Total 100.0%

22
Inventory Control Technique
Max-Min Technique Min Level = RP + Safety Stock Max Level = EOQ + (Q/2) Barcode Technique RFID Technology
 Barcode Technique. RFID Technology.")
23
Barcode Technique Barcode เป็นรหัสแท่งที่สามารถช่วยจำแนกประเภทและชนิดของสินค้าได้ จาก ประเภท ชนิด ลักษณะ ขนาด สี ที่แตกต่างกัน ด้วยการสื่อความหมายระหว่างสื่ออิเล็กทรอนิกส์กับผู้ใช้ ทำให้เกิดความถูกต้อง รวดเร็ว แม่นยำ ระบบ Barcode เป็นระบบรหัสชนิดหนึ่งที่อยู่ในรูปสัญลักษณ์แท่งสีขาวสลับสีดำ ขนาดต่างๆกัน ยาว สั้น หนา บาง ต่างๆกัน เพื่อที่เครื่องสแกนเนอร์ (Scanner) จะสามารถอ่านและแปลความหมายออกมาในรูปตัวเลขและเครื่องคอมพิวเตอร์สามารถรับรู้ได้ด้วยการแปลงเป็นสัญญาณดิจิตอล (Digital Signal)
 จะสามารถอ่านและแปลความหมายออกมาในรูปตัวเลขและเครื่องคอมพิวเตอร์สามารถรับรู้ได้ด้วยการแปลงเป็นสัญญาณดิจิตอล (Digital Signal)")
24
Barcode Technique 885 0088 6 0 801 6 885 รหัสประเทศไทย
885 รหัสประเทศไทย 0088 รหัสสมาชิกสถาบันรหัสแท่งไทย 60801 รหัสสินค้า สมาชิกต้องกำหนด ขึ้นเอง ตัวเลขตรวจสอบความถูกต้องของคอมพิวเตอร์เพื่อพิสูจน์ว่าตัวเลขทั้งหมดที่อยู่ด้านหน้านั้นถูกต้อง เรียกว่า Digit Number

25
Barcode Technique

26
Barcode Technique Barcode Printer Barcode Software PDT
(Portable Data Terminal) RFID Technology
 RFID Technology.")
งานนำเสนอที่คล้ายกัน


>")


>")
