ดาวน์โหลดงานนำเสนอ
งานนำเสนอกำลังจะดาวน์โหลด โปรดรอ

1
Hypertension & Diabetes Mellitus in the Elderly
รศ.นพ. ประเสริฐ อัสสันตชัย เวชศาสตร์ผู้สูงอายุ ภาควิชาเวชศาสตร์ป้องกันและสังคม คณะแพทยศาสตร์ศิริราชพยาบาล

2
Prevalence of chronic diseases among the Thai elderly Health System Research Institute 1998
age group 60-69 70-79 80-89 > 90 Knee arthralgia 22.9 26.1 20.8 Low back pain 16.5 17.9 17.7 10.4 Hypertension 14.9 15.0 14.6 6.2 Vision problem 10.2 14.4 16.7 Diabetes mellitus 10.0 7.0 3.1 2.1 Ischemic heart dis. 2.0 4.7 4.2 Stroke 1.7 2.2 3.8 Dementia 1.6 2.4 3.5

3
Conditions related to hypertension in the Thai elderly
Conditions related to hypertension in the Thai elderly Health System Research Institute 1999 HT (%) Normal p value Dementia 4.1 2.8 < 0.05 Long term disability 24.9 16.2 < 0.001 Barthel Activity of daily living 2.63 2.27
 Normal. p value. Dementia < Long term disability < Barthel Activity of daily living")
4
Chronic diseases influenced long term disability
Chronic diseases influenced long term disability Health System Research Institute 1998 Odds ratio AR* Pop.AR** Accident -- 421 217.2 Stroke 16.89 788 190.7 Eye disease 1.93 152 182.9 Knee pain 1.81 76 179.9 Hypertension 1.50 112 166.0 * AR: attributable risk , ** Pop.AR : population attributable risk

5
60-74 yr. > 75 yr. rate YLL* Circulatory dis. 574 452567 1936
Mortality rate of diseases among the Thai Elderly (per 105) Health Policy and Planning Institute 2000 60-74 yr. > 75 yr. rate YLL* Circulatory dis. 574 452567 1936 376946 Cancer 564 461888 897 89321 Diabetes mellitus 213 178984 348 56542 COPD 209 159142 920 162844 GI diseases 114 94674 301 57937 YLL : year of life lost – number of years lost due to premature death
 Health Policy and Planning Institute yr. > 75 yr. rate. YLL* Circulatory dis Cancer Diabetes mellitus COPD GI diseases YLL : year of life lost – number of years lost due to premature death.")
6
A Worldwide Challenge for the 21st Century
Atherosclerosis: A Worldwide Challenge for the 21st Century “Cardiovascular disease accounts for 14.8 million deaths per year worldwide” W.H.O. report 1998 Atherosclerotic plaque rupture Localised myocardial infarction

8
Atherothrombosis: Main Cause of Major Ischemic (Vascular) Events
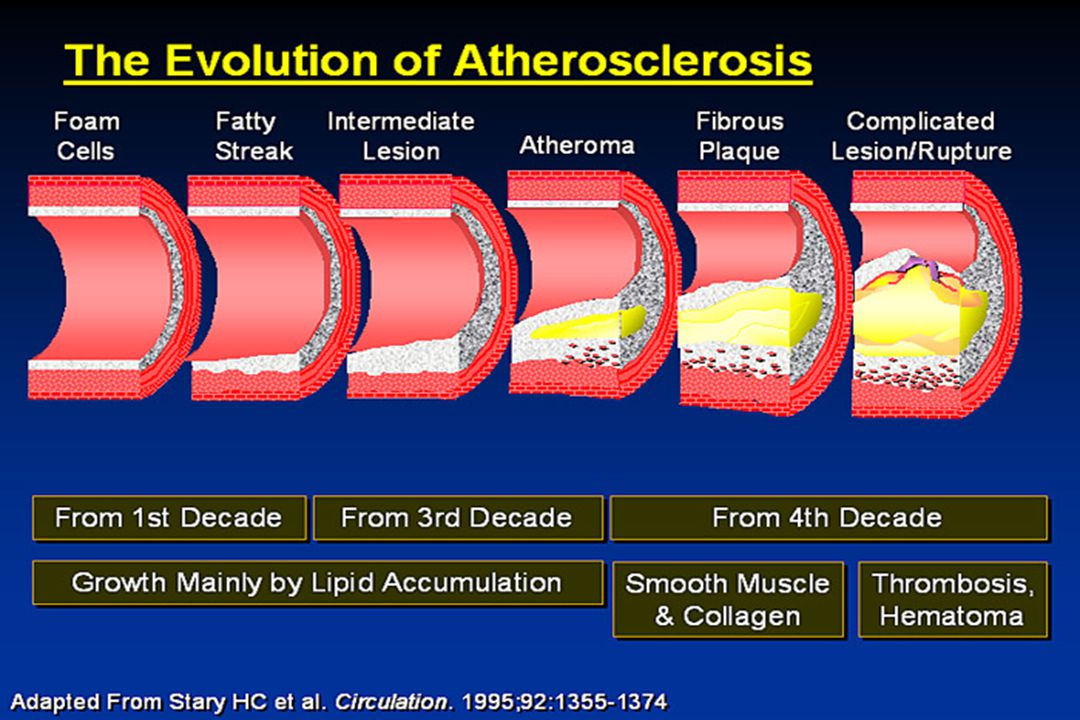
Atherothrombosis is characterized by a sudden (unpredictable) atherosclerotic plaque disruption (rupture or erosion) leading to platelet activation and thrombus formation Atherothrombosis is the underlying condition that results in events leading to myocardial infarction, ischemic stroke, and vascular death • Atherothrombosis is characterized by an unpredictable, sudden disruption (rupture or erosion/fissure) of an atherosclerotic plaque, which leads to platelet activation and thrombus formation. • The left hand image illustrates the rapid progression of atherothrombosis, showing a disrupted coronary plaque with occlusive thrombosis superimposed.1 • The right hand image shows plaque erosion with an acute coronary thrombosis.2 • Atherothrombosis is the underlying condition that results in events leading to myocardial infarction, ischemic stroke, and vascular death. Cardiovascular, cerebrovascular and peripheral vascular disease (also known as peripheral arterial disease) are part of a continuum of diseases with the common underlying pathophysiology of atherothrombosis. References 1. Falk E et al. Circulation 1995; 92: 657–671. 2. Arbustini E et al. Heart 1999; 82: 269–272. Plaque rupture1 Plaque erosion2 1. Falk E et al. Circulation 1995; 92: 657– Arbustini E et al. Heart 1999; 82: 269–272
 atherosclerotic plaque disruption (rupture or erosion) leading to platelet activation and thrombus formation. Atherothrombosis is the underlying condition that results in events leading to myocardial infarction, ischemic stroke, and vascular death. • Atherothrombosis is characterized by an unpredictable, sudden disruption (rupture or erosion/fissure) of an atherosclerotic plaque, which leads to platelet activation and thrombus formation. • The left hand image illustrates the rapid progression of atherothrombosis, showing a disrupted coronary plaque with occlusive thrombosis superimposed.1. • The right hand image shows plaque erosion with an acute coronary thrombosis.2. • Atherothrombosis is the underlying condition that results in events leading to myocardial infarction, ischemic stroke, and vascular death. Cardiovascular, cerebrovascular and peripheral vascular disease (also known as peripheral arterial disease) are part of a continuum of diseases with the common underlying pathophysiology of atherothrombosis. References. 1. Falk E et al. Circulation 1995; 92: 657– Arbustini E et al. Heart 1999; 82: 269–272. Plaque rupture1. Plaque erosion2. 1. Falk E et al. Circulation 1995; 92: 657– Arbustini E et al. Heart 1999; 82: 269–272.")
9
Increasing Worldwide* Prevalence of Atherothrombotic Manifestations1
Populations aged > 50 year old 205.0 million (5.1% since 1997) 222.2 million (13.9% since 1997) 9.1 million (12.8% since 1997) Myocardial infarction 10.7 million (32.7% since 1997) The burden of atherothrombosis is growing. Prevalence of myocardial infarction and ischemic stroke is estimated to rise by approximately one third from 1997–2005. The increases in prevalence of these conditions is growing faster than the elderly population and therefore cannot be entirely explained by changing population demographics. Increased survival after a first event and secondary prevention contribute to this increase in prevalence. Ischemic stroke 7.1 million (11.8% since 1997) 8.4 million (31.6% since 1997) *Projected populations of people aged over 50 years, and estimated prevalence of myocardial infarction and ischemic stroke cumulated in 14 countries: Belgium, Canada, Denmark, Finland, France, Germany, Italy, Netherlands, Norway, Spain, Sweden, Switzerland, UK, USA 1. Guillot F, Moulard O. Circulation 1998; 98(abstr suppl 1): 1421. Reference: 1. Guillot F, Moulard O. Circulation 1998; 98(abstr suppl 1): 1421.
 million. (13.9% since 1997) 9.1 million. (12.8% since 1997) Myocardial infarction million. (32.7% since 1997) The burden of atherothrombosis is growing. Prevalence of myocardial infarction and ischemic stroke is estimated to rise by approximately one third from 1997–2005. The increases in prevalence of these conditions is growing faster than the elderly population and therefore cannot be entirely explained by changing population demographics. Increased survival after a first event and secondary prevention contribute to this increase in prevalence. Ischemic stroke. 7.1 million. (11.8% since 1997) 8.4 million. (31.6% since 1997) *Projected populations of people aged over 50 years, and estimated prevalence of myocardial infarction and ischemic stroke cumulated in 14 countries: Belgium, Canada, Denmark, Finland, France, Germany, Italy, Netherlands, Norway, Spain, Sweden, Switzerland, UK, USA. 1. Guillot F, Moulard O. Circulation 1998; 98(abstr suppl 1): Reference: 1. Guillot F, Moulard O. Circulation 1998; 98(abstr suppl 1):")
10
Atherothrombosis* is the Leading Cause of Death Worldwide†1
52% Cancer 24% Infectious Disease 19% Pulmonary disease 14% Violent death 12% AIDS 5% Atherothrombosis is the leading cause of death worldwide – accounting for 52% of deaths. An estimated 55,694,000 people worldwide died from atherothrombotic disease in 2000 (manifested as cardiovascular disease, ischemic heart disease and cerebrovascular disease). Other main causes of death were: AIDS (5%) Violent death (12%) Pulmonary disease (14%) Infectious diseases (19%) Cancer (24%). Reference 1. World Health Organization. The World Health Report Geneva: WHO; 2001. 10 20 30 40 50 60 Mortality (%) *Cardiovascular disease, ischemic heart disease and cerebrovascular disease †Worldwide defined as Member States by WHO Region (African, Americas, Eastern Mediterranean, European, South-East Asia and Western Pacific). 1. World Health Organization. The World Health Report Geneva: WHO; 2001.
. Other main causes of death were: AIDS (5%) Violent death (12%) Pulmonary disease (14%) Infectious diseases (19%) Cancer (24%). Reference. 1. World Health Organization. The World Health Report Geneva: WHO; Mortality (%) *Cardiovascular disease, ischemic heart disease and cerebrovascular disease. †Worldwide defined as Member States by WHO Region (African, Americas, Eastern. Mediterranean, European, South-East Asia and Western Pacific). 1. World Health Organization. The World Health Report Geneva: WHO;")
11
Atherothrombosis Will Remain the Leading Cause of Disease Burden
The ten leading causes of disease burden in developed countries 1990–2020 1990 disease or injury1 Rank order 2020 disease or injury2 Ischemic heart disease 1 Ischemic heart disease Cerebrovascular disease 2 Cerebrovascular disease Road traffic accidents 3 Unipolar major depression Bronchus and lung cancers 4 Trachea bronchus & lung cancers Self-inflicted injuries 5 Road traffic accidents Conditions during perinatal 6 Alcohol use Lower respiratory infections 7 Osteoarthritis • According to the Global Burden of Disease project, sponsored by the World Health Organization, World Bank, and Harvard School of Public Health, manifestations of atherothrombosis (ischemic heart disease and cerebrovascular disease) were the primary causes of death and disability in developed countries in This finding remains true even when underdeveloped countries are added to the analysis. • Despite advances in medical and surgical therapies, ischemic heart disease is projected to remain the primary cause of morbidity and mortality in developed countries in the year References 1. Murray CJL, Lopez AD. In: Murray CJL, Lopez AD, eds. Global Burden of Disease. Vol 1. Boston, MA: Harvard University Press; 1996. 2. Murray CJL, Lopez AD. Lancet 1997; 349: 1498–1504. Congenital anomalies 8 Dementia and other CNS disorders Colon and rectal cancers 9 COPD Stomach cancer 10 Self-inflicted Injuries Note:Disease burden is measured in disability-adjusted life years (DALYs), a measure that combines the impact on health of years lost due to premature death and years lived with a disability. One DALY is equivalent to one lost year of healthy life 1. Murray and Lopez. Global Burden of Disease Study. 1996 2. Murray and Lopez. Global Burden of Disease Study. 1997
 were the primary causes of death and disability in developed countries in This finding remains true even when underdeveloped countries are added to the analysis. • Despite advances in medical and surgical therapies, ischemic heart disease is projected to remain the primary cause of morbidity and mortality in developed countries in the year References. 1. Murray CJL, Lopez AD. In: Murray CJL, Lopez AD, eds. Global Burden of Disease. Vol 1. Boston, MA: Harvard University Press; Murray CJL, Lopez AD. Lancet 1997; 349: 1498–1504. Congenital anomalies. 8. Dementia and other CNS disorders. Colon and rectal cancers. 9. COPD. Stomach cancer. 10. Self-inflicted Injuries. Note:Disease burden is measured in disability-adjusted life years (DALYs), a measure that combines the impact on health of years lost due to premature death and years lived with a disability. One DALY is equivalent to one lost year of healthy life. 1. Murray and Lopez. Global Burden of Disease Study Murray and Lopez. Global Burden of Disease Study")
12
Distribution of systolic pressure with age
Framingham , Health Survey for England 1994

13
Distribution of diastolic pressure with age

14
Distribution of systolic pressure with age among Thai elderly. P
Distribution of systolic pressure with age among Thai elderly P. Assantachai. Comprehensive study of the Thai elderly. Mahidol Fund 2000 central north south northeast

15
Hypertension in the Elderly
What should be concerned before diagnosis ? Why do they need treatment ? When is the best time of intervention ? What is precaution before starting treatment ? How many forms of management ? What is the most appropriate drug of choice ? How far should blood pressure be lowered? Is it the same between the young old elderly and the very old elderly ?

16
Special Characteristics in Geriatrics
RAMPS Reduced body reserve Atypical presentation Multiple pathology Polypharmacy Social adversity

17
What should be concerned before diagnosis of hypertension in the elderly ?
Variability: white-coat (labile) hypertension Pseudohypertension: Osler manoeuvre ISH :exclude aortic insufficiency, severe anemia, hyperthyroidism, arteriovenous fistula, fever. Secondary hypertension: renal artery stenosis Associated disease : DM, dyslipidemia Personal factors : salt intake, obesity, exercise, smoking, drinking
 hypertension. Pseudohypertension: Osler manoeuvre. ISH :exclude aortic insufficiency, severe anemia, hyperthyroidism, arteriovenous fistula, fever. Secondary hypertension: renal artery stenosis. Associated disease : DM, dyslipidemia. Personal factors : salt intake, obesity, exercise, smoking, drinking.")
18
958 cases followed up 42 months:
White-coat vs. Sustained Hypertension in the Elderly Kario K, et al. J Am Coll Cardiol 2001;38: 958 cases followed up 42 months: 147 (normal), 236 (white-coat), 575 (HT) Stroke occurrence: Normal: 3 (2.0%) White-coat : 5 (2.1%) HT : 54 (9.4%) Incidence of stroke : in white-coat hypertension = in normotensives = ¼ risk in sustained hypertension.
, 236 (white-coat), 575 (HT) Stroke occurrence: Normal: 3 (2.0%) White-coat : 5 (2.1%) HT : 54 (9.4%) Incidence of stroke : in white-coat hypertension = in normotensives = ¼ risk in sustained hypertension.")
19
Isolated Systolic Hypertension-Why?

20
Secondary hypertension in the elderly
Early diagnosis of HT before 30 yrs.old without family history Recent worsening of blood pressure + premature target organ damage Resistant to treatment Recent poor control without obvious reason ARF after ACEI or ARB

21
Hypertension in the Elderly
What should be concerned before diagnosis ? Why do they need treatment ? When is the best time of intervention ? What is precaution before starting treatment ? How many forms of management ? What is the most appropriate drug of choice ? How far should blood pressure be lowered? Is it the same between the young old elderly and the very old elderly ?

22
Mulrow et al. Hypertension in the elderly. JAMA 1994, p.1932-8.
Why do they need treatment?__ 3 stages of clinical trials of hypertension in the elderly 5-yr NNT Aust EWPHE 16 14 37 52 STOP SHEP MRCOA-beta Summary

23
Second stage of antihypertensive trial in the elderly
การศึกษาโดยใช้ยาในกลุ่ม calcium channel blocker ในช่วงปี ค.ศ ได้แก่ การศึกษา STONE (ใช้ยา nifedipine), SYST-CHINA (ใช้ยา nitrendipine), HOT (ใช้ยา felodipine ) และ PREVENT (ใช้ยา amlodipine) พบว่าสามารถลดอุบัติการณ์ของโรคระบบหัวใจและหลอดเลือดได้ถึงร้อยละ
, SYST-CHINA (ใช้ยา nitrendipine), HOT (ใช้ยา felodipine ) และ PREVENT (ใช้ยา amlodipine) พบว่าสามารถลดอุบัติการณ์ของโรคระบบหัวใจและหลอดเลือดได้ถึงร้อยละ")
24
Third stage of antihypertensive trial in the elderly
การศึกษาโดยใช้ยาในกลุ่ม angiotensin converting enzyme inhibitor และกลุ่มangiotensin receptor blocker (ARB) ในช่วงปี ค.ศ.2000 ถึงปัจจุบัน การศึกษา HOPE ที่ใช้ยา ramipril พบว่าสามารถลดอัตราตายจากโรคระบบหัวใจและหลอดเลือดได้อย่างมีนัยสำคัญ (relative risk 0.74) การศึกษา PROGRESS ที่ใช้ยา perindopril ร่วมกับ indapamide ในผู้ป่วยที่มีประวัติโรคหลอดเลือดสมอง พบว่าลดความเสี่ยงต่อการเกิดโรคหลอดเลือดสมองซ้ำได้อย่างมีนัยสำคัญ การศึกษา SCOPE ใช้ยา candesartan ซึ่งไม่ลดอุบัติการณ์ของโรคหลักในระบบหัวใจและหลอดเลือด แต่ลดอุบัติการณ์ของ non-fatal stroke ได้อย่างมีนัยสำคัญราวร้อยละ 28
 ในช่วงปี ค.ศ.2000 ถึงปัจจุบัน. การศึกษา HOPE ที่ใช้ยา ramipril พบว่าสามารถลดอัตราตายจากโรคระบบหัวใจและหลอดเลือดได้อย่างมีนัยสำคัญ (relative risk 0.74) การศึกษา PROGRESS ที่ใช้ยา perindopril ร่วมกับ indapamide ในผู้ป่วยที่มีประวัติโรคหลอดเลือดสมอง พบว่าลดความเสี่ยงต่อการเกิดโรคหลอดเลือดสมองซ้ำได้อย่างมีนัยสำคัญ. การศึกษา SCOPE ใช้ยา candesartan ซึ่งไม่ลดอุบัติการณ์ของโรคหลักในระบบหัวใจและหลอดเลือด แต่ลดอุบัติการณ์ของ non-fatal stroke ได้อย่างมีนัยสำคัญราวร้อยละ 28.")
25
Hypertension in the Elderly
What should be concerned before diagnosis ? Why do they need treatment ? When is the best time of intervention ? What is precaution before starting treatment ? How many forms of management ? What is the most appropriate drug of choice ? How far should blood pressure be lowered? Is it the same between the young old elderly and the very old elderly ?

26
salt intake In general: every Na 100 mmol SP 4-5 mmHg
When is the best time of intervention? How many forms of management? _Nonpharmacological salt intake In general: every Na 100 mmol SP 4-5 mmHg DP 2 mmHg In elderly: every Na 100 mmol SP 10 mmHg In elderly with 95 percentile of BP : every Na 100 mmol SP 15 mmHg Law MR, et al. Br Med J 1991; 312:

27
How many forms of management? _Nonpharmacological
Obesity Among the Thai elderly: Hypertensive cases BMI, subcutaneous fat, percent body fat ประเสริฐ อัสสันตชัย โครงการศึกษาวิจัยครบวงจรเรื่องผู้สูงอายุไทย ม.มหิดล 2542. INTERSALT study BW 10 kg. SP 3 mmHg Dyer et al. J Hum Hypertension 1989; 3: 299.

28
How many forms of management? _Nonpharmacological
Exercise Regular exercise decrease blood pressure in general : 3 / 3 mmHg in mild hypertensives : 6 / 7 mmHg in overt hypertensives : 10 / 8 mmHg Fagard RH J Hypertension 1993; 11(Suppl.5) : S47-52.
 : S")
29
Hypertension in the Elderly
What should be concerned before diagnosis ? Why do they need treatment ? When is the best time of intervention ? What is precaution before starting treatment ? How many forms of management ? What is the most appropriate drug of choice ? How far should blood pressure be lowered? Is it the same between the young old elderly and the very old elderly ?

30
What are precautions before starting antihypertensive treatment?
High prevalence of postural hypotension High prevalence of multiple pathology Polypharmacy Poor drug compliance due to inadequate knowledge Heterogeneity among the elderly

31
Hypertension in the Elderly
What should be concerned before diagnosis ? Why do they need treatment ? When is the best time of intervention ? What is precaution before starting treatment ? How many forms of management ? What is the most appropriate drug of choice ? How far should blood pressure be lowered? Is it the same between the young old elderly and the very old elderly ?

32
DM CRF CVD MI CHF BPH PAD COPD diuretic BB CCB ACEI ARB
Aldo. Antago AFB DM CRF CVD MI CHF BPH osteoporosis PAD COPD

33
General Guidelines in Prescription for the Elderly
Complete and correct diagnosis Non-pharmacological treatment first Well known pharmacokinetics and pharmacodynamics in the elderly Start low go slow Avoid polypharmacy Friendly to use New symptom may be the warning sign Check compliance regularly

34
Hypertension in the Elderly
What should be concerned before diagnosis ? Why do they need treatment ? When is the best time of intervention ? What is precaution before starting treatment ? How many forms of management ? What is the most appropriate drug of choice ? How far should blood pressure be lowered? Is it the same between the young old elderly and the very old elderly ?

35
Study of INDANA Group Gueyffier F, et al. Lancet 1999; 353:793-6.
Retrospective meta-analysis study 1670 cases aged > 80 years old 874 treated cases: 57 strokes, 34 deaths 796 controls : 77 strokes, 28 deaths Conclusion: treatment prevented 34% strokes (95% CI:8-52) major cardiovascular events ↓22% ไม่ลดอัตราตายเนื่องจากโรคในระบบหัวใจและหลอดเลือด กลับมีอัตราตายเพิ่มขึ้นร้อยละ 14 จากทุกสาเหตุรวมกันในกลุ่มที่ได้รับการรักษาอย่างไม่มีนัยสำคัญทางสถิติ
 major cardiovascular events ↓22% ไม่ลดอัตราตายเนื่องจากโรคในระบบหัวใจและหลอดเลือด กลับมีอัตราตายเพิ่มขึ้นร้อยละ 14 จากทุกสาเหตุรวมกันในกลุ่มที่ได้รับการรักษาอย่างไม่มีนัยสำคัญทางสถิติ")
36
How far should blood pressure be lowered
How far should blood pressure be lowered? Is it the same between the young old elderly and the very old elderly ? Rationale A 5-year retrospective study in Finland in 561 older people aged > 85 yrs,mortality was greatest among lowest BP, and lowest among SP > 160, DP > 90 mmHg. Mattila et al. Br Med J 1988; 296:887-9. A study in California, a paradoxical increase in survival was found in men aged > 75 yrs with increasing DP. Langer et al. Br Med J 1989; 298:

37
80 years old milestone !! Antihypertensive treatment in < 80 years old : stroke 25 – 40% cardiac events 13 – 27% all cardiovascular events 17 – 40% Antihypertensive treatment in > 80 years old ??

38
The Hypertension in the Very Elderly Trial (HYVET). Bulpitt CJ et al
The Hypertension in the Very Elderly Trial (HYVET) Bulpitt CJ et al. J Hypertension 2003;21: submitted for entry = 1372 excluded 89 cases: SBP< 160, DBP<90 & >109 antihypertensives treatment age<80 mental test score < 7 creatinine > 150 μmol/l 1283 cases assigned to groups
 Bulpitt CJ et al. J Hypertension 2003;21: submitted for entry = excluded 89 cases: SBP< 160, DBP<90 & >109. antihypertensives treatment. age<80. mental test score < 7. creatinine > 150 μmol/l cases assigned to groups.")
39
The Hypertension in the Very Elderly Trial (HYVET)
Diuretic n = 426 ACE inhibitor n = 431 No treatment n = 426 pilot trail : March 1994 – June 1998 died n = 30 lost n = 9 complete 386 died n = 27 lost n = 7 complete = 397 died n = 22 lost n = 8 complete = 394

40
Treatment better Control better 0.2 0.4 0.6 0.8 1.0 1.2 1.4 1.6 1.8 2.0 2.2 Total mortality Double-blind trials (meta-analysis) (RR=1.14, p =0.05) All trails (meta-analysis) (RR=1.06, p =0.30) (RR=1.307, p=0.34) HYVET-Pilot (diuretic) (RR=1.143, p=0.65) HYVET-Pilot (ACE) (RR=1.227, p=0.42) HYVET-Pilot (all active)
 (RR=1.14, p =0.05) All trails (meta-analysis) (RR=1.06, p =0.30) (RR=1.307, p=0.34) HYVET-Pilot (diuretic) (RR=1.143, p=0.65) HYVET-Pilot (ACE) (RR=1.227, p=0.42) HYVET-Pilot (all active)")
41
Treatment better Control better 0.2 0.4 0.6 0.8 1.0 1.2 1.4 1.6 1.8 2.0 2.2 Total mortality Double-blind trials (meta-analysis) (RR=1.14, P=0.05) All trails (meta-analysis) (RR=1.06, P=0.30) HYVET-Pilot (diuretic) HYVET-Pilot (ACE) HYVET-Pilot (all active) (RR=1.307, P=0.34) (RR=1.143, P=0.65) (RR=1.227, P=0.42) Cardiovascular death Double-blind trials (meta-analysis) (RR=1.11, P=0.42) All trails (meta-analysis) (RR=1.01, P=0.93) HYVET-Pilot (diuretic) HYVET-Pilot (ACE) HYVET-Pilot (all active) (RR=1.166, P=0.62) (RR=1.087, P=0.79) (RR=1.127, P=0.66) Stroke events Double-blind trials (meta-analysis) All trails (meta-analysis) (RR=0.67, P=0.010) HYVET-Pilot (diuretic) (ACE) (all active) (RR=0.64, P=0.01) (RR=0.313, P=0.01) (RR=0.629, P=0.21) (RR=0.471, P=0.02)
 (RR=1.14, P=0.05) All trails (meta-analysis) (RR=1.06, P=0.30) HYVET-Pilot (diuretic) HYVET-Pilot (ACE) HYVET-Pilot (all active) (RR=1.307, P=0.34) (RR=1.143, P=0.65) (RR=1.227, P=0.42) Cardiovascular death. Double-blind trials (meta-analysis) (RR=1.11, P=0.42) All trails (meta-analysis) (RR=1.01, P=0.93) HYVET-Pilot (diuretic) HYVET-Pilot (ACE) HYVET-Pilot (all active) (RR=1.166, P=0.62) (RR=1.087, P=0.79) (RR=1.127, P=0.66) Stroke events. Double-blind trials (meta-analysis) All trails (meta-analysis) (RR=0.67, P=0.010) HYVET-Pilot. (diuretic) (ACE) (all active) (RR=0.64, P=0.01) (RR=0.313, P=0.01) (RR=0.629, P=0.21) (RR=0.471, P=0.02)")
42
HYVET-Pilot study_CONCLUSION
Treatment of 1000 patients for 1 year may reduce stroke events by 19 (9 non-fatal), but may be associated with 20 extra non-stroke deaths. Each stroke saved by antiHT treatment, there was one non-stroke death.
, but may be associated with 20 extra non-stroke deaths. Each stroke saved by antiHT treatment, there was one non-stroke death.")
43
HYVET_main clinical trial
International trial 3,845 cases aged > 80 with SP mmHg. Indapamide SR or placebo Add-on : ACEI (perindopril mg/d.) Target BP 150 / 80 mmHg. Results: all stroke (RR 0.59, p 0.009), relative risk reduction - 41% all death from any cause (RR 0.76, p 0.007), relative risk reduction – 24%
 Target BP 150 / 80 mmHg. Results: all stroke (RR 0.59, p 0.009), relative risk reduction - 41% all death from any cause (RR 0.76, p 0.007), relative risk reduction – 24%")
44
Quality of life in Syst-Eur Trial. Fletcher AE, et al
Quality of life in Syst-Eur Trial Fletcher AE, et al. J Hypertension 2002; 20: Isolated systolic hypertension in older people 4695 cases aged > 60 yrs, SP & DP >95 mmHg. Double-blind RCT, nitrendipine+enalapril+HCTZ Target sitting SP<150 (at least 20 mmHg reduction from baseline) followed for 2 yrs. Result: 42% ↓strokes (p<.003), 26%↓cardiac events (p<.03) Quality of life:Sickness Impact Profile(SIP), Brief Assessment Index (BAI) Conclusion: active treatment was associated with some small adverse impacts on quality of life.
 followed for 2 yrs. Result: 42% ↓strokes (p<.003), 26%↓cardiac events (p<.03) Quality of life:Sickness Impact Profile(SIP), Brief Assessment Index (BAI) Conclusion: active treatment was associated with some small adverse impacts on quality of life.")
45
การศึกษาที่ติดตามผู้ที่มีอายุ 80 ปีขึ้นไปที่เป็นโรคความดันเลือดสูงและได้รับยาลดความดันเลือดเป็นเวลา 5 ปี พบว่าในบรรดาผู้ที่มีระดับความดันเลือดอยู่ในเกณฑ์ที่ควบคุมได้ ผู้ที่มีระดับความดันเลือดต่ำกว่าจะมีอัตราการรอดชีวิตที่ 5 ปี (5-year survival rate) น้อยกว่า ผู้ที่มีระดับความดันเลือดสูงกว่า Oates DJ, et al. Blood pressure and survival in the oldest old. J Am Geriatr Soc 2007 ; 55 : 383-8

46
จากการศึกษา SHEP พบว่าในกลุ่มผู้ที่มีระดับความดันเลือดปกติหลังได้รับการรักษา ถ้า DP ลดลงไปอีก 5 มม.ปรอทจากค่าเฉลี่ย 77 มม.ปรอท จะมีความเสี่ยงต่อการเกิดโรคในระบบหัวใจและหลอดเลือดเพิ่มขึ้นถึงร้อยละ ปรากฏการณ์นี้เรียกว่า J – curve ซึ่งพบใน DP มากกว่าจาก SP Somes GW, et al. The role of diastolic blood pressure when treating isolated systolic hypertension. Arch Intern Med 1999 ; 159 : Cruickshank JM, et al. Benefits and potential harm of lowering high blood pressure. Lancet 1987; 1 :

47
Endocrine Changes in Aging _ Diabetes mellitus
Physiologic changes Clinical correlation impaired glucose tolerance ↑ DM ↑ BS 5.3 mg%/10yrs after 30 years old ↑ serum insulin metabolic syndrome ↓ DHEA ↓ libido ↓free testosterone ↓ T sick euthyroid syndrome ↑ PTH interpretation & ↓Ca ↓ vitamin D by skin ↓ Ca absorption ↑ serum homocysteine ↑ atherosclerosis

48
Natural History of Type 2 Diabetes
Glucose Post-prandial glucose 100 200 150 300 250 350 mg/dL Fasting glucose Relative to normal 250 Insulin resistance 200 (%) 150 100 At risk for diabetes 50 Beta-cell dysfunction Insulin level -10 -5 5 10 15 20 25 30 Years R.M. Bergenstal, International Diabetes Center
 At risk for. diabetes. 50. Beta-cell dysfunction. Insulin level Years. R.M. Bergenstal, International Diabetes Center.")
49
Changes in blood glucose levels with age
Postprandial Fasting Elahi D, et al. Eur J Clin Nutr 2000; 54: S112-S120.

50
Diabetes mellitus Symptoms of DM + random blood glucose > 200 mg/dl. (8 hours) Fasting plasma glucose > 126 mg/dl Two-hour plasma glucose > 200 mg/dl NB: repeat testing on a different day

51
Diabetes mellitus Ideal goals for glycemic control normal goal action
Preprandial < <80, >140 glucose HbA1c(%) < 6 < 7 > 8
 < 6 < 7 > 8.")
52
Diabetes Mellitus One of the most common non-communicable diseases
Fourth leading cause of death in most developed countries More than 194 million people with diabetes worldwide Incidence of diabetes is increasing – estimated to rise to 333 million by 2025 To more than double in Africa, the Eastern Mediterranean and Middle East, and South-East Asia To rise by 50% in North America, 20% in Europe, 85% in South and Central Americas and 75% in the Western Pacific Diabetes is now one of the most common non-communicable disease globally. It is the fourth leading cause of death in most developed countries.1 There are currently more than 194 million people with diabetes worldwide and there is evidence to suggest that it is epidemic in many developing countries. World Health Organisation figures estimate that the number of people developing diabetes will rise to 333 million by In 2003, the five countries with the largest numbers of persons with diabetes were India (35.5 million), China (23.8 million), the United States (16 million), Russia (9.7 million) and Japan (6.7 million). By 2025, the prevalence of diabetes is expected to more than double in Africa, the Eastern Mediterranean and Middle East, and South-East Asia, to rise by 50% in North America, 20% in Europe, 85% in South and Central Americas and 75% in the Western Pacific. For developing countries, there will be a projected increase of a 170% of cases; for developed countries, there will be a projected rise of 42%.1 Reference 1. International Diabetes Federation website. ( International Diabetes Federation website
, China (23.8 million), the United States (16 million), Russia (9.7 million) and Japan (6.7 million). By 2025, the prevalence of diabetes is expected to more than double in Africa, the Eastern Mediterranean and Middle East, and South-East Asia, to rise by 50% in North America, 20% in Europe, 85% in South and Central Americas and 75% in the Western Pacific. For developing countries, there will be a projected increase of a 170% of cases; for developed countries, there will be a projected rise of 42%.1. Reference. 1. International Diabetes Federation website. ( node=6) International Diabetes Federation website.")
53
The Chronic Complications of Diabetes Mellitus
Macrovascular complications: Cardiovascular disease Leading cause of diabetes related deaths (increases mortality and stroke by 2 to 4 times) Microvascular complications: Retinopathy Leading cause of adult blindness Nephropathy Accounts for 44% of new cases of ESRD Neuropathy 60-70% of patients with diabetes have nervous system damage The complications of diabetes include an increased risk of heart disease and stroke, hypertension, retinopathy, renal disease and neuropathy.1 Heart disease is the leading cause of diabetes-related deaths. Adults with diabetes have heart disease death rates about 2 to 4 times higher than adults without diabetes. The risk for stroke is 2 to 4 times higher among people with diabetes. Diabetes is the leading cause of new cases of blindness among adults 20 to 74 years old, and diabetic retinopathy causes from 12,000 to 24,000 new cases of blindness each year. Diabetes is the leading cause of treated end-stage renal disease (ESRD), accounting for 44 percent of new cases, and about 60 to 70 percent of people with diabetes have mild to severe forms of nervous system damage. The results of such damage include impaired sensation or pain in the feet or hands, slowed digestion of food in the stomach, carpal tunnel syndrome, and other nerve problems. Severe forms of diabetic nerve disease are a major contributing cause of lower-extremity amputations. More than 60 percent of nontraumatic lower-limb amputations in the United States occur among people with diabetes. Reference 1. National Diabetes Statistics. General information and national estimates on diabetes in the United States National Diabetes Statistics US 2000
 Microvascular complications: Retinopathy. Leading cause of adult blindness. Nephropathy. Accounts for 44% of new cases of ESRD. Neuropathy % of patients with diabetes have nervous system damage. The complications of diabetes include an increased risk of heart disease and stroke, hypertension, retinopathy, renal disease and neuropathy.1. Heart disease is the leading cause of diabetes-related deaths. Adults with diabetes have heart disease death rates about 2 to 4 times higher than adults without diabetes. The risk for stroke is 2 to 4 times higher among people with diabetes. Diabetes is the leading cause of new cases of blindness among adults 20 to 74 years old, and diabetic retinopathy causes from 12,000 to 24,000 new cases of blindness each year. Diabetes is the leading cause of treated end-stage renal disease (ESRD), accounting for 44 percent of new cases, and about 60 to 70 percent of people with diabetes have mild to severe forms of nervous system damage. The results of such damage include impaired sensation or pain in the feet or hands, slowed digestion of food in the stomach, carpal tunnel syndrome, and other nerve problems. Severe forms of diabetic nerve disease are a major contributing cause of lower-extremity amputations. More than 60 percent of nontraumatic lower-limb amputations in the United States occur among people with diabetes. Reference. 1. National Diabetes Statistics. General information and national estimates on diabetes in the United States National Diabetes Statistics US")
54
Patients with Diabetes at Similar Risk to No Diabetes with CVD: OASIS
3 18 21 24 6 9 12 15 Months of follow-up 0.25 0.20 0.15 0.10 0.05 Event rate (Total mortality) diabetes plus CVD (n=1448) RR 2.88 no diabetes/no CVD (n=2796) RR 1.0 no diabetes plus CVD (n=3503) RR 1.71 diabetes plus no CVD (n=569) RR 1.99 The Organization to Assess Strategies for Ischaemic Syndromes (OASIS) study assessed the 2-year prognosis of patients with diabetes and patients with no diabetes, with and without prior cardiovascular disease (hospitalisation for unstable angina or non-Q-wave myocardial infarction).1 The study showed that patients with diabetes and previous cardiovascular disease were at greatest risk of death, and that of patients with diabetes without prior cardiovascular disease had a similar event rate to patients with no diabetes with previous cardiovascular disease, showing that diabetes is a CHD risk equivalent. Reference Malmberg K, Yusuf S, Gerstein HC et al. Circulation 2000;102:1014–1019. Adapted from Circulation 2000;102:1014–1019, with permission from Lippincott Williams & Wilkins. RR relative reduction Malmberg K et al. Circulation 2000;102:
 diabetes plus CVD (n=1448) RR no diabetes/no CVD (n=2796) RR 1.0. no diabetes plus CVD (n=3503) RR diabetes plus no CVD (n=569) RR The Organization to Assess Strategies for Ischaemic Syndromes (OASIS) study assessed the 2-year prognosis of patients with diabetes and patients with no diabetes, with and without prior cardiovascular disease (hospitalisation for unstable angina or non-Q-wave myocardial infarction).1 The study showed that patients with diabetes and previous cardiovascular disease were at greatest risk of death, and that of patients with diabetes without prior cardiovascular disease had a similar event rate to patients with no diabetes with previous cardiovascular disease, showing that diabetes is a CHD risk equivalent. Reference. Malmberg K, Yusuf S, Gerstein HC et al. Circulation 2000;102:1014–1019. Adapted from Circulation 2000;102:1014–1019, with permission from Lippincott Williams & Wilkins. RR relative reduction. Malmberg K et al. Circulation 2000;102:")
55
Survival Post-MI in Men and Women With and Without Diabetes
100 90 80 70 60 50 40 Months Post-MI Men Women Survival, % Diabetes No diabetes n=228 n=1628 n=568 Data from the Minnesota Heart Survey1 showed that the prevalence of diabetes in MI patients increased over time ( ) in both men (8.2 vs. 16.8%, p<0.001) and women (16.0 vs. 25.8%, p=0.01). In-hospital mortality after MI was greater in patients with diabetes compared with those who did not have diabetes (odds ratio 1.5, p<0.01). In addition, among those patients who survived and were discharged from hospital, the risk of death was 40% higher in individuals with diabetes compared with those without diabetes after 6 years of follow-up (p<0.01). Reference Sprafka JM, Burke GL, Folsom AR et al. Diabetes Care. 1991;14:537–543. Copyright © 1991 American Diabetes Association. Adapted from Diabetes Care 1991;14:537–543, with permission from The American Diabetes Association. n=156 Sprafka JM et al. Diabetes Care. 1991;14:
 in both men (8.2 vs. 16.8%, p<0.001) and women (16.0 vs. 25.8%, p=0.01). In-hospital mortality after MI was greater in patients with diabetes compared with those who did not have diabetes (odds ratio 1.5, p<0.01). In addition, among those patients who survived and were discharged from hospital, the risk of death was 40% higher in individuals with diabetes compared with those without diabetes after 6 years of follow-up (p<0.01). Reference. Sprafka JM, Burke GL, Folsom AR et al. Diabetes Care. 1991;14:537–543. Copyright © 1991 American Diabetes Association. Adapted from Diabetes Care 1991;14:537–543, with permission from The American Diabetes Association. n= Sprafka JM et al. Diabetes Care. 1991;14:")
56
Metabolic syndrome Abdominal obesity (waist circumference > 90 cm. in men and > 80 cm.in women) 2 of 4 of the followings: Triglyceride > 150 HDL < 40 in men, < 50 in women Hypertension : BP > 130 / 85 Fasting blood glucose > 100 or DM case

57
NCEP ATP III: The Metabolic Syndrome
Recommends a diagnosis when 3 of these risk factors are present Risk Factor Defining Level Abdominal obesity (Waist circumference) Men Women >102 cm (>40 in) >88 cm (>35 in) TG 150 mg/dL (1.7 mmol/L) HDL-C The diagnosis of the metabolic syndrome, as defined by the NCEP ATP III guidelines, is established when 3 or more of the above risk determinants are present.1 The metabolic syndrome is a secondary target of risk-reduction therapy, after the primary goal of LDL-C reduction. The metabolic syndrome is associated with a constellation of lipid and non-lipid risk factors of metabolic origin, and include abdominal obesity, atherogenic dyslipidaemia, hypertension, insulin resistance (with or without glucose intolerance), and prothrombic and proinflammatory states. NCEP ATP III provides a clinically useful definition of the metabolic syndrome because of the measurement of fasting glucose, rather than insulin resistance as seen in the WHO definition. Reference Expert Panel on Detection, Evaluation, and Treatment of High Blood Cholesterol in Adults. JAMA 2001:285;2486–2497. Adapted from JAMA 2001;285:2486–2497, with permission from the American Medical Association. All rights reserved. Men Women <40 mg/dL (1.0 mmol/L) <50 mg/dL (1.3 mmol/L) Blood pressure 130/85 mm Hg Fasting glucose 110 mg/dL (6.0 mmol/L) NCEP, Adult Treatment Panel III, JAMA 2001:285;
 Men Women. >102 cm (>40 in) >88 cm (>35 in) TG. 150 mg/dL (1.7 mmol/L) HDL-C. The diagnosis of the metabolic syndrome, as defined by the NCEP ATP III guidelines, is established when 3 or more of the above risk determinants are present.1 The metabolic syndrome is a secondary target of risk-reduction therapy, after the primary goal of LDL-C reduction. The metabolic syndrome is associated with a constellation of lipid and non-lipid risk factors of metabolic origin, and include abdominal obesity, atherogenic dyslipidaemia, hypertension, insulin resistance (with or without glucose intolerance), and prothrombic and proinflammatory states. NCEP ATP III provides a clinically useful definition of the metabolic syndrome because of the measurement of fasting glucose, rather than insulin resistance as seen in the WHO definition. Reference. Expert Panel on Detection, Evaluation, and Treatment of High Blood Cholesterol in Adults. JAMA 2001:285;2486–2497. Adapted from JAMA 2001;285:2486–2497, with permission from the American Medical Association. All rights reserved. Men Women. <40 mg/dL (1.0 mmol/L) <50 mg/dL (1.3 mmol/L) Blood pressure. 130/85 mm Hg. Fasting glucose. 110 mg/dL (6.0 mmol/L) NCEP, Adult Treatment Panel III, JAMA 2001:285;")
58
IDF Consensus Definition of the Metabolic Syndrome
The new IDF definition is: Central obesity: waist circumference 94 cm for Europid men 80 for Europid women, with ethnicity specific values for other groups (for South Asians: > 90 cm. for men, > 80 cm. for women) Plus any two of the following four factors: raised TG level: 150 mg/dL (1.7 mmol/L) or specific treatment for this lipid abnormality reduced HDL-C: <40 mg/dL (1.03 mmol/L) in males and <50 mg/dL (1.29 mmol/L) in females or specific treatment for this lipid abnormality raised blood pressure: 130/85 mmHg or treatment of previously diagnosed hypertension raised fasting plasma glucose (FPG) 100 mg/dL (5.6 mmol/L) or previously diagnosed type 2 diabetes In April 2005, the International Diabetes Federation (IDF) issued a global consensus statement presenting a new worldwide definition of the metabolic syndrome to facilitate early detection and more intensive management, in hopes of reducing the long-term risk of cardiovascular disease (CVD) and diabetes.1 The IDF panel included experts from six continents who specialize in diabetes, cardiology, lipidology, public health, epidemiology, genetics, metabolism, and nutrition. The metabolic syndrome, which includes diabetes or prediabetes, abdominal obesity, unfavorable lipid profile and hypertension, triples the risk of myocardial infarction or stroke and doubles mortality from these conditions. It also increases the risk of developing type 2 diabetes, if not already present, fivefold. Recent data from Australia and the U.S. suggest that up to one quarter of the adult population may have the metabolic syndrome.1 The new diagnostic criteria are central obesity, defined as waist equal to or more than 94 cm for males and 80 cm for females in Europids, and ethnic-specific levels in Chinese, Japanese and South Asians; together with two of the following: raised triglycerides of at least 1.7 mmol/L or 150 mg/dL; low HDL-cholesterol, defined as less than 1.04 mmol/L (40 mg/dL) in males and less than 1.29 mmol/L (50 mg/dL) in females; raised blood pressure of at least 130/85 mm Hg; and fasting hyperglycemia, defined as glucose equal to or greater than 5.6 mmol/L (100mg/dL) or previous diagnosis of diabetes or impaired glucose tolerance.1 Reference 1. IDF Consensus Worldwide Definition of the Metabolic Syndrome. IDF Consensus Worldwide Definition of the Metabolic Syndrome.
 Plus any two of the following four factors: raised TG level: 150 mg/dL (1.7 mmol/L) or specific treatment for this lipid abnormality. reduced HDL-C: <40 mg/dL (1.03 mmol/L) in males and <50 mg/dL (1.29 mmol/L) in females or specific treatment for this lipid abnormality. raised blood pressure: 130/85 mmHg or treatment of previously diagnosed hypertension. raised fasting plasma glucose (FPG) 100 mg/dL (5.6 mmol/L) or previously diagnosed type 2 diabetes. In April 2005, the International Diabetes Federation (IDF) issued a global consensus statement presenting a new worldwide definition of the metabolic syndrome to facilitate early detection and more intensive management, in hopes of reducing the long-term risk of cardiovascular disease (CVD) and diabetes.1 The IDF panel included experts from six continents who specialize in diabetes, cardiology, lipidology, public health, epidemiology, genetics, metabolism, and nutrition. The metabolic syndrome, which includes diabetes or prediabetes, abdominal obesity, unfavorable lipid profile and hypertension, triples the risk of myocardial infarction or stroke and doubles mortality from these conditions. It also increases the risk of developing type 2 diabetes, if not already present, fivefold. Recent data from Australia and the U.S. suggest that up to one quarter of the adult population may have the metabolic syndrome.1. The new diagnostic criteria are central obesity, defined as waist equal to or more than 94 cm for males and 80 cm for females in Europids, and ethnic-specific levels in Chinese, Japanese and South Asians; together with two of the following: raised triglycerides of at least 1.7 mmol/L or 150 mg/dL; low HDL-cholesterol, defined as less than 1.04 mmol/L (40 mg/dL) in males and less than 1.29 mmol/L (50 mg/dL) in females; raised blood pressure of at least 130/85 mm Hg; and fasting hyperglycemia, defined as glucose equal to or greater than 5.6 mmol/L (100mg/dL) or previous diagnosis of diabetes or impaired glucose tolerance.1. Reference. 1. IDF Consensus Worldwide Definition of the Metabolic Syndrome. IDF Consensus Worldwide Definition of the Metabolic Syndrome.")
59
Proportion with a major CHD event
Risk of Major CHD Event Associated with High Insulin Levels in Men without Diabetes Years Proportion with a major CHD event 5 0.05 0.10 0.15 0.20 0.25 1.00 10 15 20 25 Log rank: Overall P = .001 Q5 vs. Q1 P < .001 Q1 Q2 Q3 Q4 Q5 The Helsinki Policemen Study,1 a large prospective epidemiological study, investigated the predictive value of hyperinsulinaemia with regard to CHD risk in 970 men aged 34 to 64 years during a 22 year follow-up who were free of CHD, other CVD and diabetes at baseline. The study showed that hyperinsulinaemia is predictive of CHD risk and to a large extent is independent of other CHD risk factors. Reference 1. Pyörälä M, Miettinen H, Laakso M et al. Circulation 1998;98:398–404. Adapted from Circulation 1998;98:398–404, with permission from Lippincott Williams & Wilkins. Q1 to Q5 = quintiles of area under the curve (AUC) insulin (Q1=lowest quintile; Q5=highest quintile). Pyörälä M et al. Circulation 1998;98:398–404.
 insulin (Q1=lowest quintile; Q5=highest quintile). Pyörälä M et al. Circulation 1998;98:398–404.")
60
ประเด็นการแนะนำอาหารสำหรับผู้ป่วยสูงอายุที่เป็นโรคเบาหวาน
ปัญหาเศรษฐานะ ปัญหาการเดิน-ทำให้การออกไปจ่ายตลาดเองลดลง สูญเสียทักษะในการประกอบอาหารได้เอง โดยเฉพาะชายหม้าย นิสัยการรับประทานที่ติดตัวมานาน สูญเสียความสามารถทางสมอง-ทำให้ไม่สามารถปฏิบัติตามคำแนะนำได้ สูญเสียความสามารถในการรับรสอาหาร ภาวะท้องผูก

61
Thank You for Your Attention

งานนำเสนอที่คล้ายกัน


 98.08% 100.02% จังหวัด.>")


