ดาวน์โหลดงานนำเสนอ
งานนำเสนอกำลังจะดาวน์โหลด โปรดรอ

1
อ. ชล บุนนาค คณะเศรษฐศาสตร์ มหาวิทยาลัยธรรมศาสตร์
ประเทศไทยอยู่ตรงไหน?: ประเด็นสำคัญเร่งด่วนจากข้อมูลของ SDSN และ World Bank อ. ชล บุนนาค คณะเศรษฐศาสตร์ มหาวิทยาลัยธรรมศาสตร์

2
SDGs World Ranking

3
SDGs dashboard for OECD countries

4
SDGs dashboard for East and South Asian Countries

5
SDGs Dashboard for Sub-Saharan African Countries

6
ประเทศไทยอยู่ตรงไหนในปี 2016?
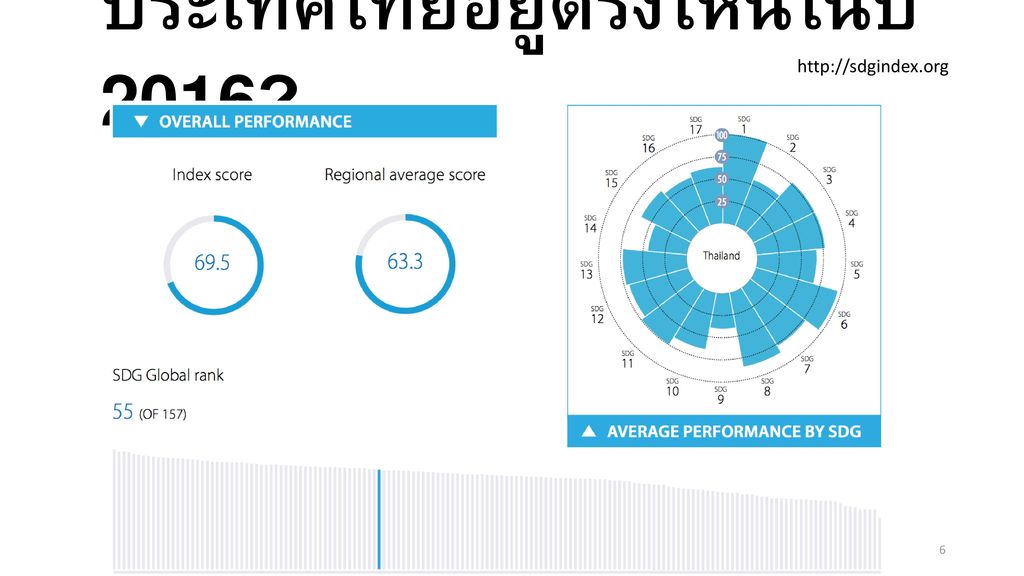
7
ประเทศไทยอยู่ตรงไหนในปี 2016?
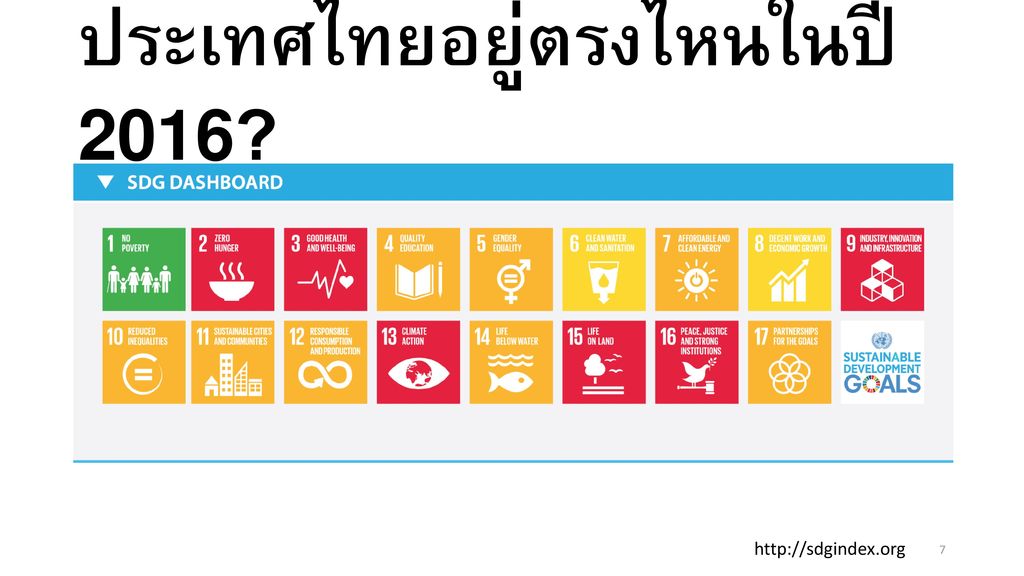
8
เป้าหมายที่ท้าทายมาก: เป้าหมายที่ 2

9
Afghanistan, Burundi, Timor-Leste
Thailand, 2012, 16.30% of children under 5

10
The Sustainable Nitrogen Management Index (SNMI) is a one- dimensional ranking score that combines two efficiency measures in crop production: Nitrogen Use Efficiency (NUE) and land use efficiency (crop yield).
 is a one- dimensional ranking score that combines two efficiency measures in crop production: Nitrogen Use Efficiency (NUE) and land use efficiency (crop yield).")
11
เป้าหมายที่ท้าทายมาก: เป้าหมายที่ 3

12
South Africa, Lesotho, Swaziland, North Korean
Thailand, 2015 172.0 per 100,000 people

13
Sri Lanka, Lithuania, Korea Rep.
Thailand, 2015, 16 per 100,000 population.

14
Zimbabwe, Venezuela, Liberia
Thailand, 2015 31.70 per 100,000 people

15
เป้าหมายที่ท้าทายมาก: เป้าหมายที่ 9

16
Proportion of Population Using Internet (%)
")
17
Korea Rep., Israel, Japan, Sweden, Denmark
Thailand, 2014, 0.483 % of GDP

18
Israel, Denmark, Finland, Korea Rep. Sweden, Singapore
Thailand, 2014, 974 per million people

19
เป้าหมายที่ท้าทายมาก: เป้าหมายที่ 13
Climate change vulnerability index: Relative standings of various countries with respect to three major impacts of climate change – 1. Weather related disasters, 2. Sea level rise, 3. loss of agricultural productivity

20
In 2013, 4.448

21
Climate Change Vulnerability Index

22
Climate Change Vulnerability Index
Climate change vulnerability index: Relative standings of various countries with respect to three major impacts of climate change – 1. Weather related disasters, 2. Sea level rise, 3. loss of agricultural productivity

23
เป้าหมายที่ท้าทายมาก: เป้าหมายที่ 15
Red list index- The change in aggregate extinction risk across groups of species. The index is based on genuine changes in the number of species in each category of extinction risk on The IUCN Red List of Threatened Species. Annual change in forest area = Total area of tree loss from 2000 to 2014, in areas with a minimum of 30% canopy cover, benchmarked against the country’s tree cover baseline extent in 2000.

24
Annual change in forest area (%)
Thailand, 2014 data, 6.4% of Annual change in forest area

25
The change in aggregate extinction risk across groups of species
The change in aggregate extinction risk across groups of species. The index is based on genuine changes in the number of species in each category of extinction risk on The IUCN Red List of Threatened Species. Upper bound = 1 Red color <0.8 Lower bound = 0.6

26
เป้าหมายที่ท้าทายมาก: เป้าหมายที่ 16

27
Hondurus, El Savadore, Venezuela
Thailand, 2014 3.90 per 100,000 people

28
Prison population total
Date Estimated National Population Prison Population Rate

29
Liberia, Syria, Cambodia, Yemen
Thailand, 2016 9.90% of firms experiencing at least one bribe payment request

30
Yemen, Syria, Cambodia, Greece
Thailand, 2016 8.50% of firms

งานนำเสนอที่คล้ายกัน


