ดาวน์โหลดงานนำเสนอ
งานนำเสนอกำลังจะดาวน์โหลด โปรดรอ

1
บรรยากาศ การเปลี่ยนแปลงบรรยากาศ
โครงสร้างของบรรยากาศ พลังงานและบรรยากาศโลก กระบวนการระเหยของน้ำ การควบแน่นและการเกิดเมฆ การเคลื่อนที่ของอากาศ แรงที่มีอิทธิพลต่อการเคลื่อนที่ของอากาศ ลม: ลมหมุนวน, ลมผิวพื้น, ลมประจำถิ่น

2
การเปลี่ยนแปลงบรรยากาศ
การหมุนเวียนของมวลอากาศ แบบจำลองการหมุนเวียนของอากาศ ระบบลมที่เกี่ยวข้องกับการหมุนของอากาศ มวลอากาศและแนวปะทะอากาศ แนวร่องมรสุม พายุหมุนเขตร้อน

3
การเปลี่ยนแปลงบรรยากาศ (1)
")
4
ส่วนประกอบของก๊าซที่สำคัญของบรรยากาศโลก
ดาวพฤหัส โลก ดาวอังคาร ความกดอากาศ ที่พื้นผิว 100,000 มิลลิบาร์ 1,000 มิลลิบาร์ 6 มิลลิบาร์ ส่วนประกอบ CO2 N2 Ar O2 H2O >98% 1% 0% 0.03% 78% 21% 0.1% 96% 2.5% 1.5% 0-0.1% ความดัน 1 bar มีค่าใกล้เคียงกับค่าความดัน 1 บรรยากาศ และ 1 กก ต่อตาราง เซนติเมตรมาก (หน่วยความดัน bar นี้ได้จัดเป็นหน่วยมาตรฐานสากลของทุกประเทศ) การเปรียบเทียบหน่วยวัดความดัน ค่าความดันบรรยากาศโดยประมาณ (Technical Atmosphere) เท่ากับ 1 Kg/cm2 = bar ค่าความดันบรรยากาศทางฟิสิกส์ (Physical Atmosphere) 1 atm = bar หน่วยอังกฤษ 1 psi = bar
 การเปรียบเทียบหน่วยวัดความดัน ค่าความดันบรรยากาศโดยประมาณ (Technical Atmosphere) เท่ากับ 1 Kg/cm2 = bar ค่าความดันบรรยากาศทางฟิสิกส์ (Physical Atmosphere) 1 atm = bar หน่วยอังกฤษ 1 psi = bar.")
5
ส่วนประกอบของบรรยากาศ
5 พันล้านปี 4 พันล้านปี 400 ล้านปี ปัจจุบัน อนาคต โลกเริ่มก่อตัว H2 He H2 H2O CH4 CO2 CO2 CO H2O N2 H2 เริ่มมี O2 N2 O2 Ar Ne He H2 Xe H2O CO2 CH4 N2O O3 สารแขวนลอย CFC

6
องค์ประกอบของอากาศแห้ง
องค์ประกอบของอากาศแห้งโดยปริมาตร (%) NITROGEN OXYGEN ARGON CARBON DIOXIDE NEON HELIUM อื่น (KRYTON, HYDROGEN, XENON, OZONE, RADON, ETC.)
 NITROGEN OXYGEN ARGON CARBON DIOXIDE NEON HELIUM อื่น (KRYTON, HYDROGEN, XENON, OZONE, RADON, ETC.)")
7
ไอน้ำ ในบรรยากาศจะมีไอน้ำอยู่เสมอ ไม่ว่าอากาศนั้นจะแห้งเพียงใดก็ตาม
ปริมาณไอน้ำในอากาศ จะมีการเปลี่ยนแปลงอยู่ตลอดเวลา ไอน้ำในอากาศมีมากที่สุดบริเวณชายฝั่งเขตร้อน คือประมาณ 3% โดยน้ำหนักของอากาศแห้ง ไอน้ำในอากาศส่วนมาก จะอยู่ในระดับความสูงไม่เกิน 6 กิโลเมตร ไอน้ำในอากาศ คือตัวการสำคัญของการเกิดลมฟ้าอากาศ โดยการเปลี่ยนสถานะระหว่างไอน้ำ น้ำ และน้ำแข็ง

8
คาร์บอนไดออกไซด์ CO2 เข้าสู่บรรยากาศโดยการหายใจของสัตว์ การสลายตัวและการ เผาไหม้ของสารคาร์บอน ภูเขาไฟระเบิด CO2 ถูกนำออกจากบรรยากาศโดยพืช ประมาณ 99% ของ CO2 ละลายอยู่ในมหาสมุทร การเปลี่ยนแปลง อุณหภูมิของน้ำจะทำให้ปริมาณของ CO2 เปลี่ยนแปลงไป ในแต่ละปี จะมี CO2 ประมาณ 10% ของ CO2 ทั้งหมดในบรรยากาศ ที่มีการหมุนเวียนเข้าและออกจากบรรยากาศ การเพิ่มขึ้นของ CO2 จะทำให้โลกมีอุณหภูมิสูงขึ้น

9
การแบ่งชั้นบรรยากาศ บรรยากาศแบ่งตามอุณหภูมิได้เป็น 4 ชั้น คือ TROPOSPHERE, STRATOSPHERE, MESOSPHERE, และ THERMOSPHERE บรรยากาศใน 3 ชั้นล่างมีส่วนผสมของก๊าซต่าง ๆ ที่เกือบคงที่ จึงเรียกรวมกันว่า HOMOSPHERE แรงดึงดูดของโลกที่มีต่อบรรยากาศ ทำให้บรรยากาศ มีการเคลื่อนตัว ตามการหมุนของโลกไปพร้อมกับพื้นโลก เสมือนหนึ่งว่าบรรยากาศ เป็นส่วนหนึ่งของพื้นโลก

10
โครงสร้างบรรยากาศของโลกแบ่งตามอุณหภูมิในแนวตั้ง

11
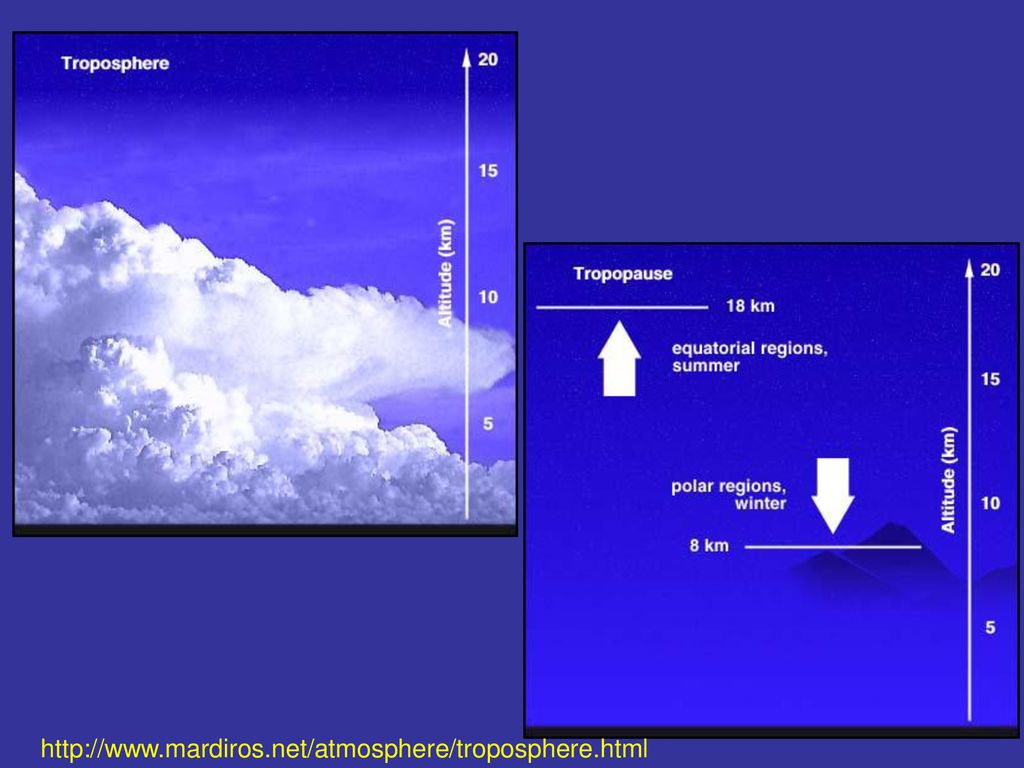
TROPOSPHERE เป็นบรรยากาศชั้นล่างสุด
ลมฟ้าอากาศเกิดขึ้นในบรรยากาศชั้นนี้ จึงเป็นชั้นที่มีความสำคัญที่สุด แหล่งความร้อนคือพื้นโลกที่ได้รับรังสีจากดวงอาทิตย์ โดยปกติอุณหภูมิลดลงตามความสูง ประมาณ 6 องศา C ต่อ 1 กม. ตอนบนสุดเรียกว่า TROPOPAUSE อยู่ที่ระดับความ สูงประมาณ 8 กิโลเมตรที่ขั้วโลก และประมาณ 18 กิโลเมตรที่เส้นศูนย์สูตร TROPOAPUSE ที่ละติจูด 30 และ 60 องศาเหนือ และใต้ มีลมความเร็วสูงมาก เรียกว่า JETSTREAM

13
JETSTREAM

14
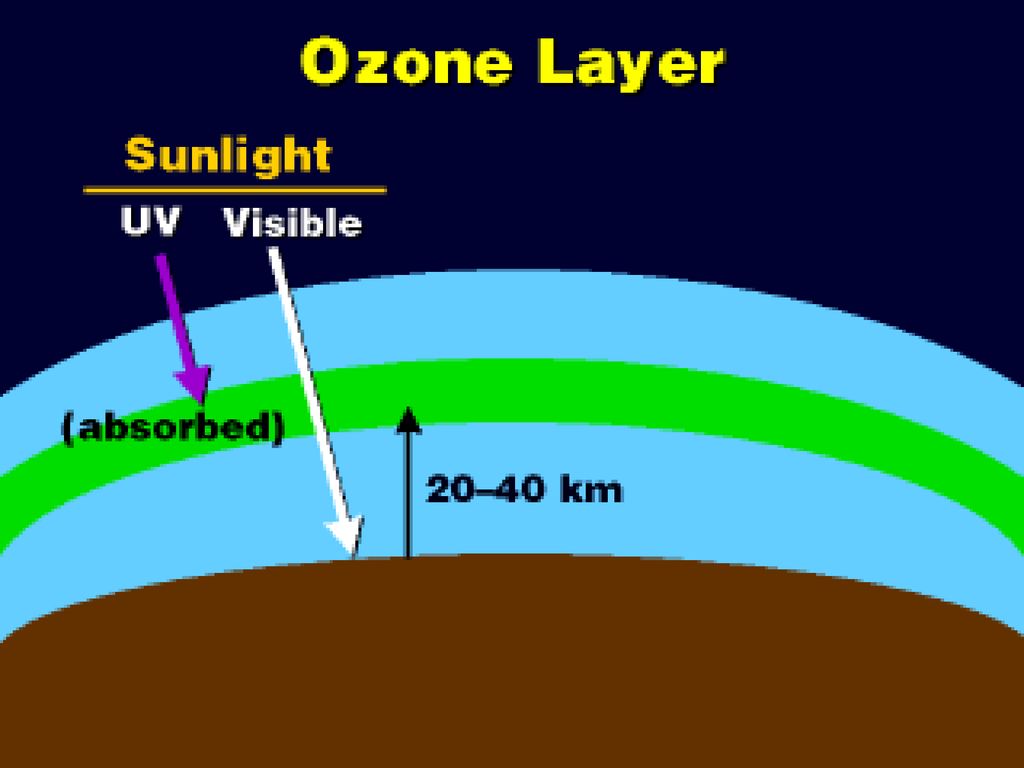
STRATOSPHERE เป็นบรรยากาศชั้นถัดไปจาก TROPOSPHERE จนถึงระดับประมาณ กิโลเมตร แหล่งความร้อนคือโอโซนในระดับบนที่ดูดซับรังสี UV ทำให้มีอุณหภูมิสูง อุณหภูมิคงที่ในระดับล่าง และเพิ่มขึ้นตามความสูงในระดับบน โดยปกติจะปราศจากเมฆ และไม่มีสภาพลมฟ้าอากาศใด ๆ เกิดขึ้น ในบรรยากาศชั้นนี้ ตอนบนสุดเรียกว่า STRATOPAUSE ในบางครั้งจะมีเมฆไข่มุก (MOTHER-OF-PEARL) เกิดขึ้นที่ระดับ กิโลเมตร พิธีสารมอนทรีออล ( Mantreal protocal ) ปัญหาการทำลายชั้นโอโซนของโลก ได้ถูกหยิบยกมาอภิปรายกันอย่างกว้างขวางใน ปี 1977 (2520 ) โครงการสิ่งแวดล้อมแห่งสหประชาชาติ (United Nations Environmental Programme ,UNEP ) ใด้ตั้งคณะกรรมการประสานงานชั้นโอโซนใน ปี 1985 (2528 ) ได้จัดทำอนุสัญญาเวียนนา ( UNEP Veinna convention) เพื่อปกป้องชั้นโอโซนโดยกลุ่มประเทศในสหภาพยุโรปและประเทศอื่น ๆ อีก 20 ประเทศต่อมาวันที่ 16 กันยายน 1987 (2530) มีการประชุมของประเทศต่าง ๆ ทั่วโลก ที่เมืองมอนทรีออล ประเทศแคนาดา เพื่อร่วมลงนามในพิธีสารมอนทรีออล ( Mantreal protocal )โดยมีผู้แทนจากประเทศต่าง ๆ 47 ประเทศ พิธีสารฉบับนี้เน้นหนักเกี่ยวกับการควบคุมการใช้ และ การผลิตสารที่ทำลายชั้นโอโซน ( Ozone Depletion substances , ODS) เช่นสาร CFC และ Hologen โดยมีข้อกำหนดเพื่อลดปริมาณการใช้ของสารที่ก่อให้เกิดช่องโหว่ของ Ozone ที่ใช้ในปี 1986 (2529 ) ลง 50 % ก่อนปี 2000 ( 2543) ข้อตกลงนี้ให้มีข้อจำกัดของการใช้สารดังกล่าว เช่นสาร CFC-11( R-11) , CFC -12 (R-12) ,CFC -113(R-113),CFC -114(R-114),CFC -115(R-115), และHalons (ซึ่งเป็นสารเคมีที่ใช้ในการดับเพลิง)ใน1990 ได้มีการทบทวนข้อตกลงใหม่ที่จะหยุดการใช้และผลิตในปี 2000 (2543) และมีการเพิ่มเติมสารที่ต้องหยุดใช้และผลิตคือตัวทำละลายที่มีส่วนประกอบของ chlorine เช่น methyl chloroform (CH3CCl3) และcarbon tetrachloride (CCl4) จาก การสำรวจและวิจัยของ NASA บริเวณขั้วโลกเหนือในชั้นบรรยากาศ Stratosphere ด้วยเครื่องบิน NASA ER-2 และดาวเทียม UARS ระหว่างฤดูหนาวปี 1992 พบว่ามีปริมาณของสาร chlorine ที่เป็นอันตรายต่อโอโซน ที่พบอยู่ในรูปของ chlorine monoxide (ClO) ซึ่งเป็นผลมาจากการทำปฏิกริยาการทำลายโอโซน ของสาร chlorine เพื่อลดการสะสมของสารที่เป็นอันตรายต่อโอโซนที่มีอยู่ปริมาณมากในชั้น บรรยากาศ Stratosphere สืบเนื่องมาจากสาร CFCs
 เกิดขึ้นที่ระดับ กิโลเมตร. พิธีสารมอนทรีออล ( Mantreal protocal ) ปัญหาการทำลายชั้นโอโซนของโลก ได้ถูกหยิบยกมาอภิปรายกันอย่างกว้างขวางใน ปี 1977 (2520 ) โครงการสิ่งแวดล้อมแห่งสหประชาชาติ (United Nations Environmental Programme ,UNEP ) ใด้ตั้งคณะกรรมการประสานงานชั้นโอโซนใน ปี 1985 (2528 ) ได้จัดทำอนุสัญญาเวียนนา ( UNEP Veinna convention) เพื่อปกป้องชั้นโอโซนโดยกลุ่มประเทศในสหภาพยุโรปและประเทศอื่น ๆ อีก 20 ประเทศต่อมาวันที่ 16 กันยายน 1987 (2530) มีการประชุมของประเทศต่าง ๆ ทั่วโลก ที่เมืองมอนทรีออล ประเทศแคนาดา เพื่อร่วมลงนามในพิธีสารมอนทรีออล ( Mantreal protocal )โดยมีผู้แทนจากประเทศต่าง ๆ 47 ประเทศ พิธีสารฉบับนี้เน้นหนักเกี่ยวกับการควบคุมการใช้ และ การผลิตสารที่ทำลายชั้นโอโซน ( Ozone Depletion substances , ODS) เช่นสาร CFC และ Hologen โดยมีข้อกำหนดเพื่อลดปริมาณการใช้ของสารที่ก่อให้เกิดช่องโหว่ของ Ozone ที่ใช้ในปี 1986 (2529 ) ลง 50 % ก่อนปี 2000 ( 2543) ข้อตกลงนี้ให้มีข้อจำกัดของการใช้สารดังกล่าว เช่นสาร CFC-11( R-11) , CFC -12 (R-12) ,CFC -113(R-113),CFC -114(R-114),CFC -115(R-115), และHalons (ซึ่งเป็นสารเคมีที่ใช้ในการดับเพลิง)ใน1990 ได้มีการทบทวนข้อตกลงใหม่ที่จะหยุดการใช้และผลิตในปี 2000 (2543) และมีการเพิ่มเติมสารที่ต้องหยุดใช้และผลิตคือตัวทำละลายที่มีส่วนประกอบของ chlorine เช่น methyl chloroform (CH3CCl3) และcarbon tetrachloride (CCl4) จาก การสำรวจและวิจัยของ NASA บริเวณขั้วโลกเหนือในชั้นบรรยากาศ Stratosphere ด้วยเครื่องบิน NASA ER-2 และดาวเทียม UARS ระหว่างฤดูหนาวปี 1992 พบว่ามีปริมาณของสาร chlorine ที่เป็นอันตรายต่อโอโซน ที่พบอยู่ในรูปของ chlorine monoxide (ClO) ซึ่งเป็นผลมาจากการทำปฏิกริยาการทำลายโอโซน ของสาร chlorine เพื่อลดการสะสมของสารที่เป็นอันตรายต่อโอโซนที่มีอยู่ปริมาณมากในชั้น บรรยากาศ Stratosphere สืบเนื่องมาจากสาร CFCs.")
16
เมฆไข่มุก (MOTHER-OF-PEARL CLOUD)
Nacreous Cloud

17
MESOSPHERE อยู่ถัดจาก STRATOSPHERE ขึ้นไปจนถึงระดับประมาณ 80 กิโลเมตร
อุณหภูมิลดลงตามความสูง เป็นชั้นบรรยากาศที่มีอุณหภูมิต่ำที่สุด คือประมาณ องศา C ที่ระดับ 80 กิโลเมตร ชั้นบนสุดเรียกว่า MESOPAUSE ในบางครั้งจะมีเมฆเรืองแสง (NOCTILUCENT CLOUD) เกิดขึ้น โดยเมฆนี้ประกอบด้วยอนุภาคฝุ่นละอองที่มีน้ำแข็งปกคลุมอยู่
 เกิดขึ้น โดยเมฆนี้ประกอบด้วยอนุภาคฝุ่นละอองที่มีน้ำแข็งปกคลุมอยู่")
18
NOCTILUCENT CLOUD

19
THERMOSPHERE อยู่ถัดจาก MESOSPHERE ขึ้นไป
แหล่งความร้อนคือการที่ก๊าซที่เบาบางในระดับบน ดูดซับรังสี X และ UV จากดวงอาทิตย์ ทำให้มีอุณหภูมิสูง และโมเลกุลของก๊าซแยกตัวออกเป็น อะตอมอิสระ อุณหภูมิเพิ่มขึ้นตามความสูงจนถึงระดับ กิโลเมตร IONIZATION เกิดได้ดีในบรรยากาศชั้นนี้ ทำให้เกิดชั้นบรรยากาศ ที่เรียกว่าIONOSPHEREซึ่งมีคุณสมบัติในการสะท้อนคลื่นวิทยุ

20
แหล่งพลังงานของบรรยากาศ
พลังงานเกือบทั้งหมดของบรรยากาศ ได้มาจากดวงอาทิตย์ ในลักษณะ ของการแผ่รังสีคลื่นแม่เหล็กไฟฟ้า พลังงานความร้อนภายในโลก พลังงานจากดาว และ พลังงานอื่น ๆ เป็นพลังงานที่น้อยมาก เมื่อเทียบกับพลังงานจากดวงอาทิตย์ พลังงานที่ปล่อยออกมาจากเมฆพายุฟ้าคะนอง 1 ก้อน มีพลังงาน เทียบเท่ากับระเบิดปรมาณูในสมัยสงครามโลกครั้งที่ 2 จำนวน 100 ลูก มีการถ่ายเทพลังงานระหว่างบรรยากาศและพื้นโลก อย่างต่อเนื่องอยู่ ตลอดเวลา และมีการถ่ายเทพลังงานในบรรยากาศจากที่หนึ่งไปยัง อีกที่หนึ่งด้วยเช่นกัน

21
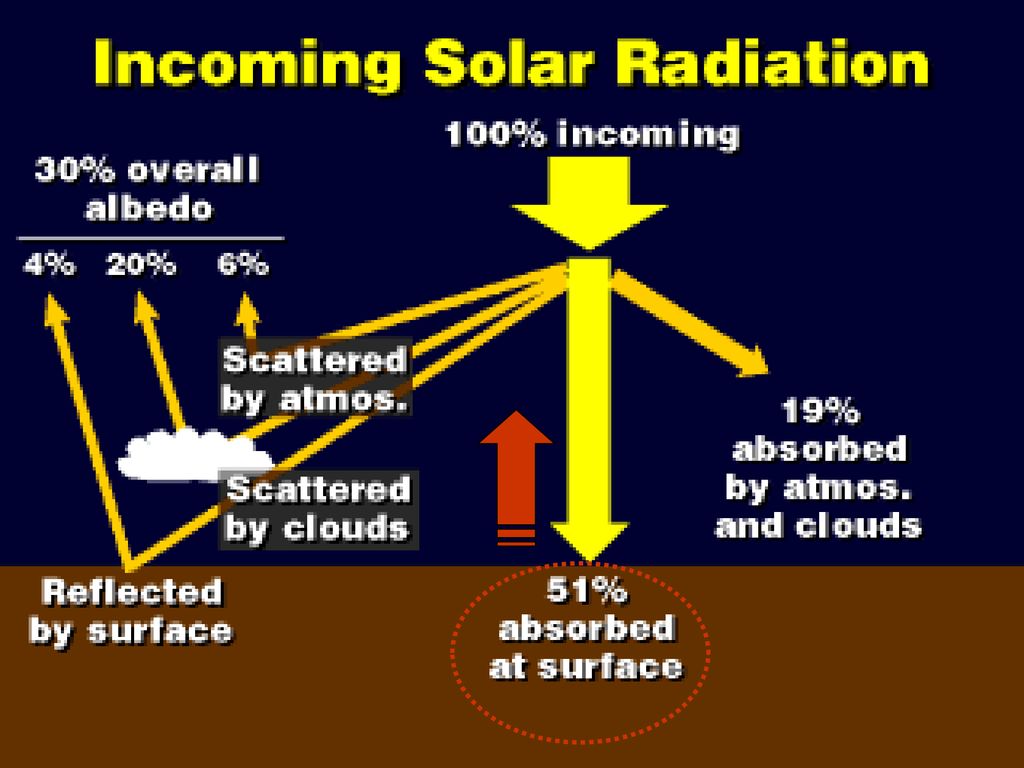
รังสีจากดวงอาทิตย์ ประมาณ 99% ของรังสีจากดวงอาทิตย์ อยู่ในช่วง ความยาวคลื่น MICRON ซึ่งถือเป็นรังสี คลื่นสั้น ดังนั้นรังสีจากดวงอาทิตย์จึงเรียก ว่าเป็น SHORT-WAVE RADIATION ในรังสีคลื่นสั้นจากดวงอาทิตย์นี้ แบ่งได้เป็น ULTRAVIOLET (UV) 7% , VISIBLE 43% , INFRARED 49% และ x, gamma, radio wave 1% ประมาณ 51% ของรังสีคลื่นสั้นจากดวงอาทิตย์จะถูกดูดซับไว้โดยพื้นโลก ที่เหลือจะกลับสู่อวกาศโดยการสะท้อนหรือการกระเจิง (SCATTERING)
 7% , VISIBLE 43% , INFRARED 49% และ x, gamma, radio wave 1% ประมาณ 51% ของรังสีคลื่นสั้นจากดวงอาทิตย์จะถูกดูดซับไว้โดยพื้นโลก ที่เหลือจะกลับสู่อวกาศโดยการสะท้อนหรือการกระเจิง (SCATTERING)")
23
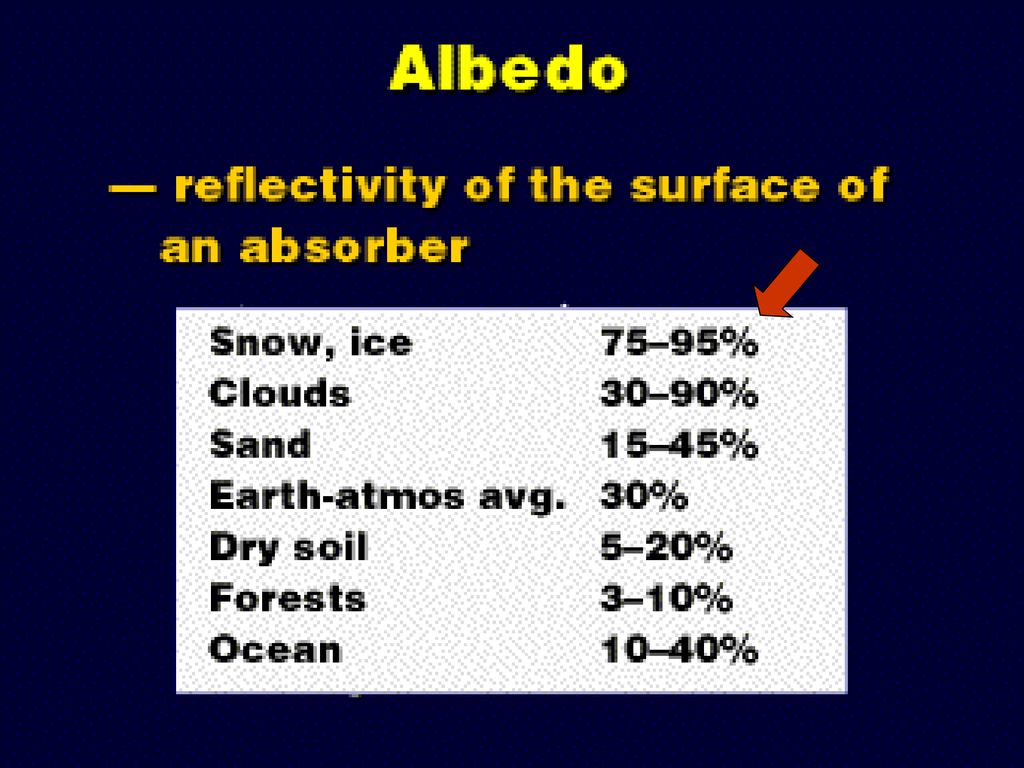
อัลบีโด อัลบีโด เป็นอัตราส่วนเปรียบเทียบค่าการสะท้อนแสงของพื้นผิว กับ ปริมาณรังสีทั้งหมดที่ตกกระทบ มักแสดงด้วยตัวเลขทศนิยมระหว่าง 0 – 1 กล่าวคือ *วัตถุที่มีการดูดกลืนรังสีอย่างสมบูรณ์ ไม่มีการสะท้อนรังสีกลับคืนเลยจะมีอัลบีโด = 0 *ส่วนวัตถุที่มีการสะท้อนแสง 100% และไม่มีการดูดกลืนรังสีเลยมีอัลบีโด = 1

24
ประเภทของสิ่งปกคลุมพื้นผิว น้ำ (เวลาเช้าหรือเย็น)
ตารางที่ 1 อัลบีโด ประเภทของสิ่งปกคลุมพื้นผิว อัลบีโด เมฆ หิมะและน้ำแข็ง ทราย ทุ่งหญ้า ป่าไม้ น้ำ (เวลาเที่ยง) น้ำ (เวลาเช้าหรือเย็น)
 น้ำ (เวลาเช้าหรือเย็น)")
26
น้ำกับบรรยากาศ Earth Surface 70% Ocean and Lakes
Much of Land covered in Ice Clouds - liquid droplets and Ice Water Strong influence on Temperature (Convection + Hydrologic Cycle)
")
27
Water Vapor and Liquid Water
Gas** Highly Compressible within Limits. Limit Changes Its Phase. Water Vapor Changes Phase at Ordinary Temperatures Found on Earth. Saturation** Air Contains as Much Water as Possible.

28
Evaporation and Condensation
Water Molecules Break Surface and Escape Condensation Water Vapor Collides with Surface Bonds with Adjacent Molecules Saturation Evaporation Rate = Condensation Rate

29
Sublimation and Deposition
Changes Phase Directly from Solid to Gas Ice to Water Vapor Deposition Changes Phase Directly from Gas to Solid Water Vapor to Ice

30
Homogeneous Nucleation
Highly Curved Droplets Require Supersaturation to Keep From Evaporating away Droplets 0.1 m - require RH* = 300% (Supersaturation of 200%) 1.0 m - require RH* = 110% (Supersaturation of 10%) Supersaturation Droplets Require High Humidity to Balance Evaporation and Condensation Pure Water Can Be Achieved only By Chance Collisions and Bonding Seldom Occurs RH* = Relative Humidity
 1.0 m - require RH* = 110% (Supersaturation of 10%) Supersaturation Droplets Require High Humidity to Balance Evaporation and Condensation. Pure Water Can Be Achieved only By Chance Collisions and Bonding Seldom Occurs. RH* = Relative Humidity.")
31
Heterogeneous Nucleation
Aerosols Hygroscopic - Water Attracting Particles Heterogeneous Nucleation Formation of Water Droplets on Hygroscopic Aerosols Condensation Nuclei Condensation is the Dissolving of Condensation Nuclei into the Water Forms a Solution

32
Condensation Nuclei Natural Continental Dust Sea Salt Volcanic Eruptions Natural Fires Marine Plankton Human (More Northern Hemisphere) Anthropogenic Burning Transportation Power Plants Chemical Plants
 Anthropogenic Burning Transportation Power Plants Chemical Plants.")
33
Cooling The Air to the Dew Point
Most Important Mechanism For Cloud Formation Lowering the Temperature to the Dew Point or Frost Point Air Temperature Changes 1. Removal or Input of Heat Diabatic Process 2. No Removal or Input of Heat Adiabatic Process

34
Adiabatic Processes No Heat is Added or Removed - not diabatic Changes in Temperature Without Changes in Energy Common in Atmosphere Most Important Way to Form Clouds

35
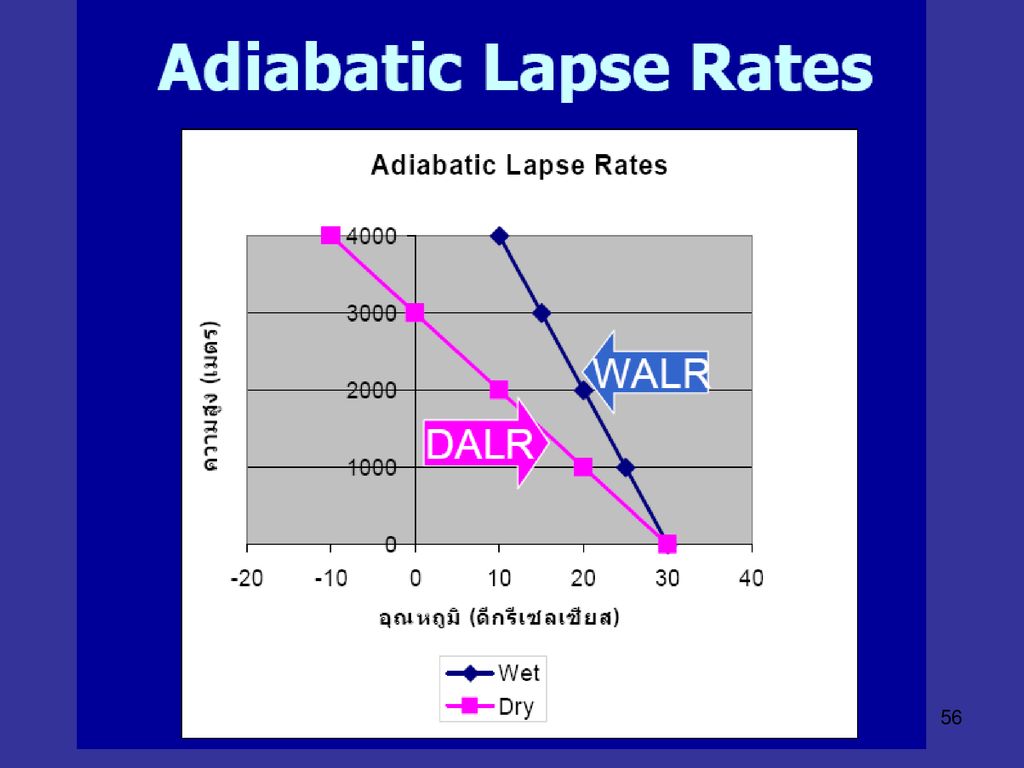
Dry Adiabatic Lapse Rate
Unsaturated Air Rises Surrounding Air Lower Pressure And Cooler therefore it expands and Cools DALR = 1.0°C per 100 meters (Constant for Dry Air)
")
36
Condensation and Dry Adiabatic Lapse Rate
Unsaturated Air Rises Cools to Dew Point (Frost) and Condensation (Disposition) Occurs Lifting Condensation Level (LCL)
 and Condensation (Disposition) Occurs. Lifting Condensation Level (LCL)")
37
Saturated Adiabatic Lapse Rate
SALR Average Value is 0.5 °C per 100 meters It is not Constant Varies with Temperature Higher Temperatures Produces a Lower Rate Cooling Gives Lower Water Content More Condensation and Release of Latent Heat At Lower Temperatures Less to Release Half of DALR Release of Latent Heat Offsets Cooling By Expansion

38
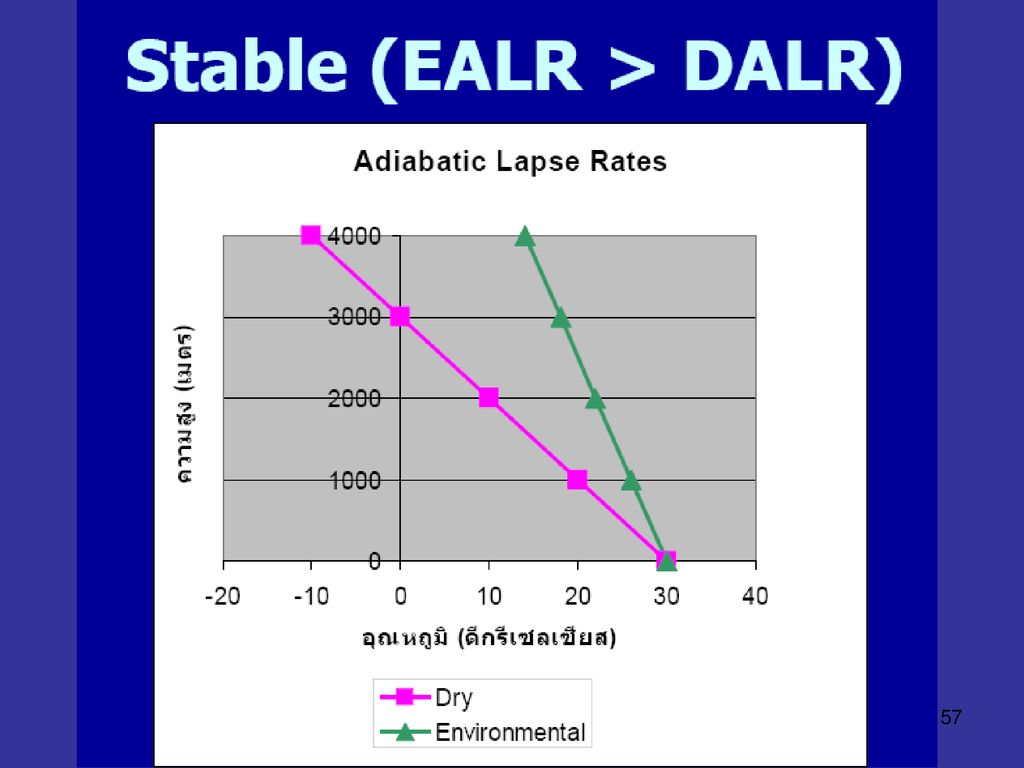
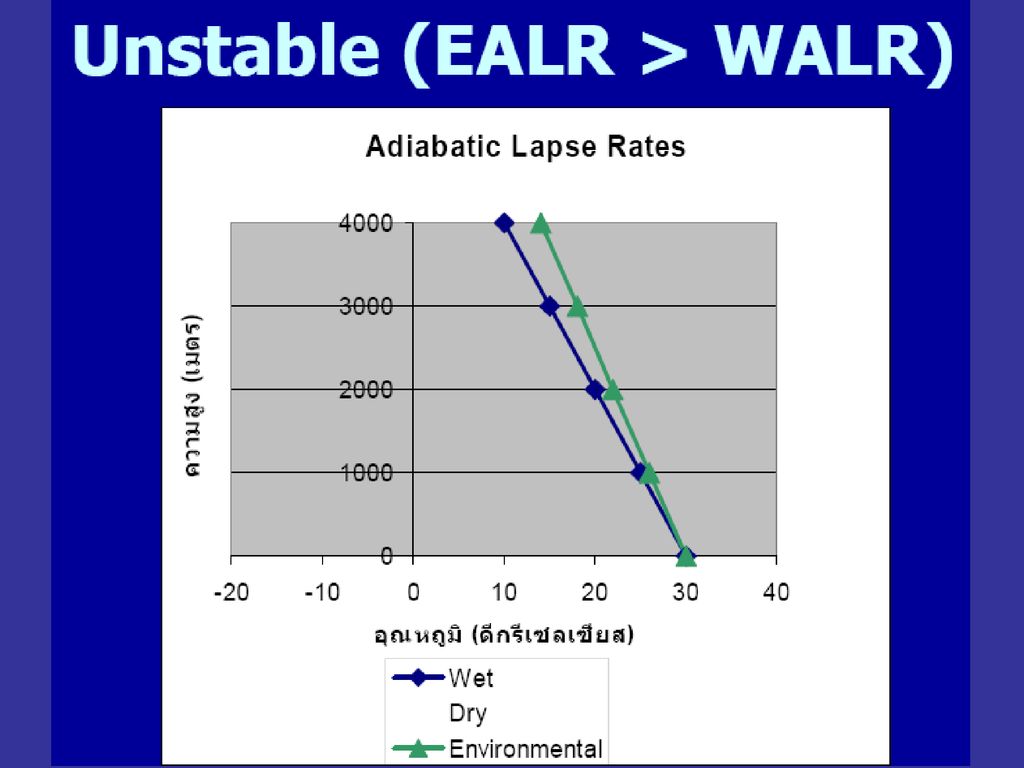
Environmental Lapse Rate
Vertical Change in Temperature in Still Air Troposphere Decreasing Temperature Highly Variable Day to Day Place to Place One Altitude To Another Can Be Steep - Changes Rapidly ELR = 0.5°C DALR = 1.0°C

39
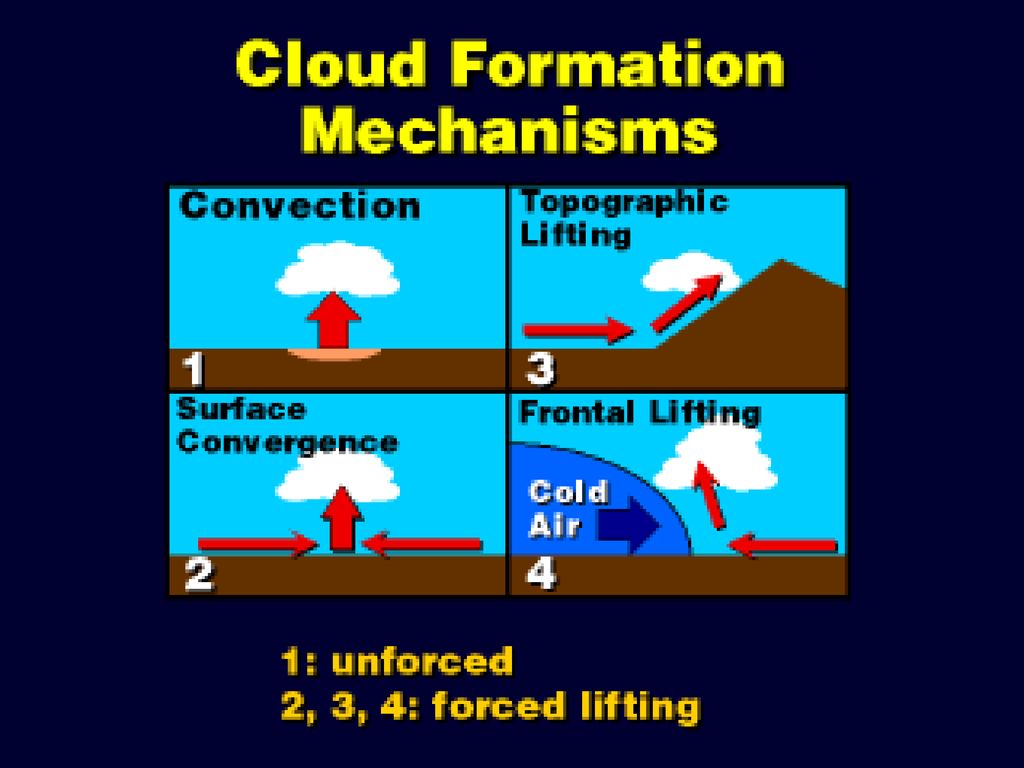
General Forms of Condensation
1. Dew 2. Frost 3. Frozen Dew 4. Fog Radiation Fog Advection Fog Upslope Fog Precipitation Fog Steam Fog 5. Clouds

40
Clouds Condensation Form: Clouds
Predominant Process: Usually by lifting of air and adiabatic cooling. Characteristics: Concentration of suspended droplets and/or ice crystals in air well above the surface.

41
Formation of Clouds Dew Point Lapse Rate (DPLR): -0.2°C / 100 m
Dry Adiabatic Lapse Rate (DALR): -1.0°C / 100 m At Surface Dew point is 10°C and Air Temperature is 18°C Temperatures Will be the Same at 1000 m Lifting Condensation Level (LCL) is 1000 m where Cloud Droplets Form. In Another 50 m All the Condensation Nuclei are Used Up and Any Additional Lifting will Only Increase Droplet Size.
: -1.0°C / 100 m. At Surface Dew point is 10°C and Air Temperature is 18°C Temperatures Will be the Same at 1000 m. Lifting Condensation Level (LCL) is 1000 m where Cloud Droplets Form. In Another 50 m All the Condensation Nuclei are Used Up and Any Additional Lifting will Only Increase Droplet Size.")
42
Dissipation of Clouds Warms by Saturated Adiabatic Lapse Rate (SALR): -0.5°C / 100 m Reaches LCL and Warms by Dry Adiabatic Lapse Rate (DALR): -1.0°C / 100 m As All the droplets have evaporated. Condensation and Dissipation are Reversible Except When Some of the Moisture is Lost by Precipitation.
: -1.0°C / 100 m As All the droplets have evaporated. Condensation and Dissipation are Reversible Except When Some of the Moisture is Lost by Precipitation.")
43
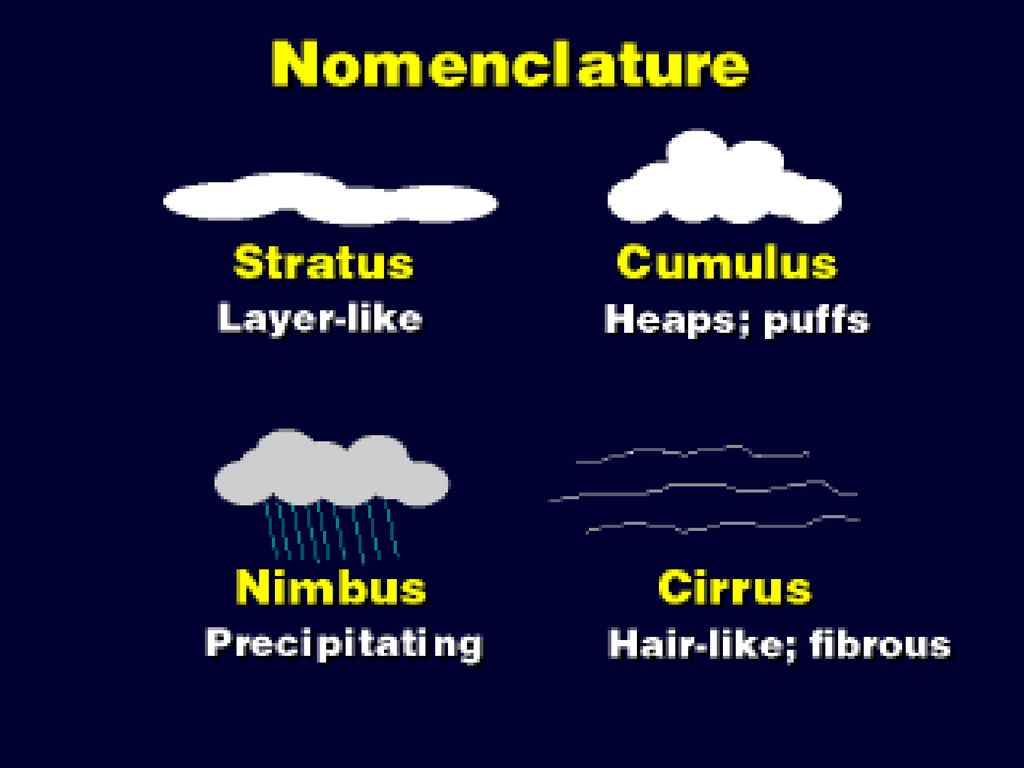
เมฆ เมื่อไอน้ำในอากาศเปลี่ยนสถานะเป็นละอองน้ำหรือ น้ำแข็ง ก็จะเกิดเป็นเมฆขึ้น (เมฆไม่ใช่ไอน้ำ) เมฆเกิดขึ้นได้ในระดับความสูง และรูปลักษณะต่างๆกัน เมฆแบ่งออกได้เป็น 2 ประเภท คือเมฆก้อน (CUMULIFORM CLOUD) และเมฆแผ่น หรือ เมฆชั้น (STRATIFORM CLOUD) เมฆก้อนมักจะปกคลุมท้องฟ้าเป็นบริเวณแคบ ๆ และมีช่องว่างระหว่าง เมฆแต่ละก้อน เมฆชั้นจะปกคลุมท้องฟ้าเป็นบริเวณกว้างต่อเนื่องกัน เมฆแบ่งตามความสูงได้เป็น เมฆชั้นสูง เมฆชั้นกลาง และเมฆชั้นต่ำ
 และเมฆแผ่น หรือ เมฆชั้น (STRATIFORM CLOUD) เมฆก้อนมักจะปกคลุมท้องฟ้าเป็นบริเวณแคบ ๆ และมีช่องว่างระหว่าง เมฆแต่ละก้อน. เมฆชั้นจะปกคลุมท้องฟ้าเป็นบริเวณกว้างต่อเนื่องกัน. เมฆแบ่งตามความสูงได้เป็น เมฆชั้นสูง เมฆชั้นกลาง และเมฆชั้นต่ำ.")
44
ตระกูลเมฆ ชั้นสูง (6-18 กม.) CIRRUS (Ci) CIRROCUMULUS (Cc)
CIROSTRATUS (Cs) ชั้นกลาง (2-8 กม.) ALTOCUMULUS (Ac) ALTOSTRATUS (As) ชั้นต่ำ (ผิวพื้น – 2 กม.) NIMBOSTRATUS (Ns) STRATOCUMULUS (Sc) STRATUS (St) เมฆก่อตัวในแนวตั้ง (ผิวพื้น – 18 กม.) CUMULUS (Cu) CUMULONIMBUS (Cb)
 ชั้นกลาง (2-8 กม.) ALTOCUMULUS (Ac) ALTOSTRATUS (As) ชั้นต่ำ (ผิวพื้น – 2 กม.) NIMBOSTRATUS (Ns) STRATOCUMULUS (Sc) STRATUS (St) เมฆก่อตัวในแนวตั้ง (ผิวพื้น – 18 กม.) CUMULUS (Cu) CUMULONIMBUS (Cb)")
46
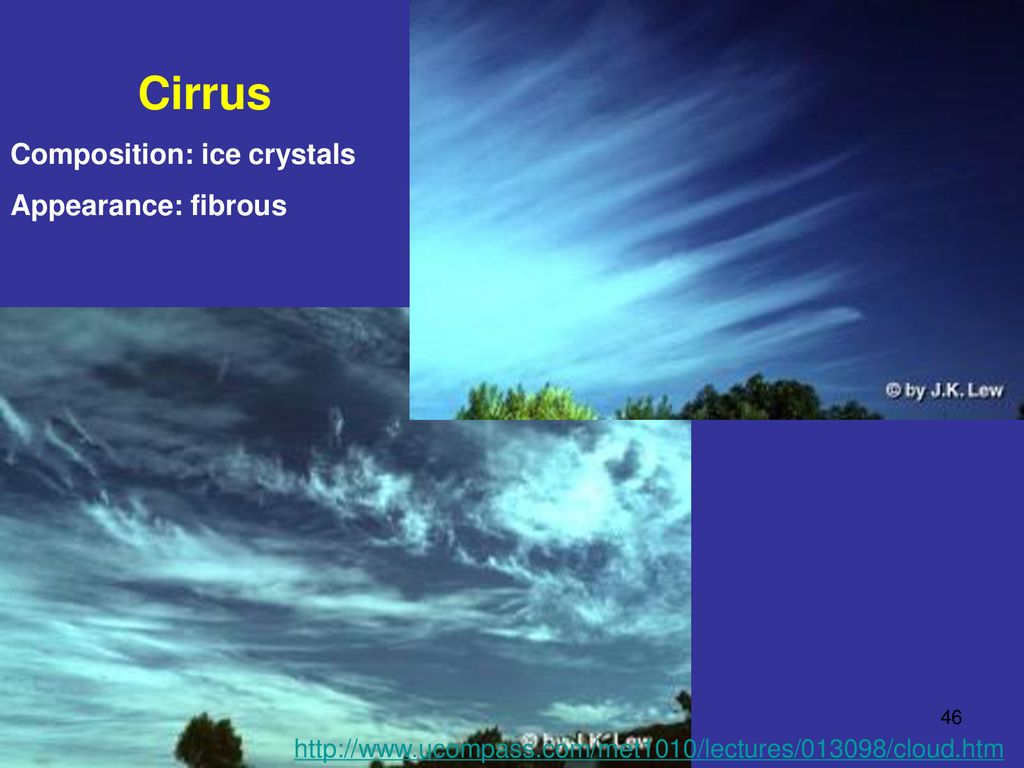
Cirrus Composition: ice crystals Appearance: fibrous
47
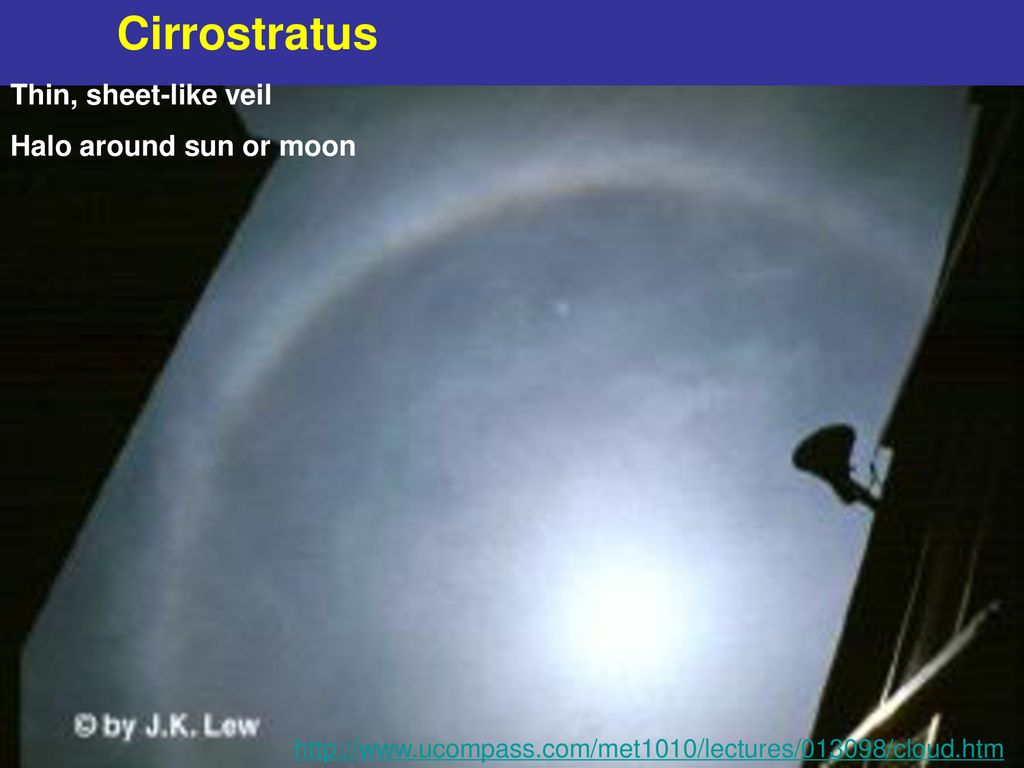
Cirrostratus Thin, sheet-like veil Halo around sun or moon
48
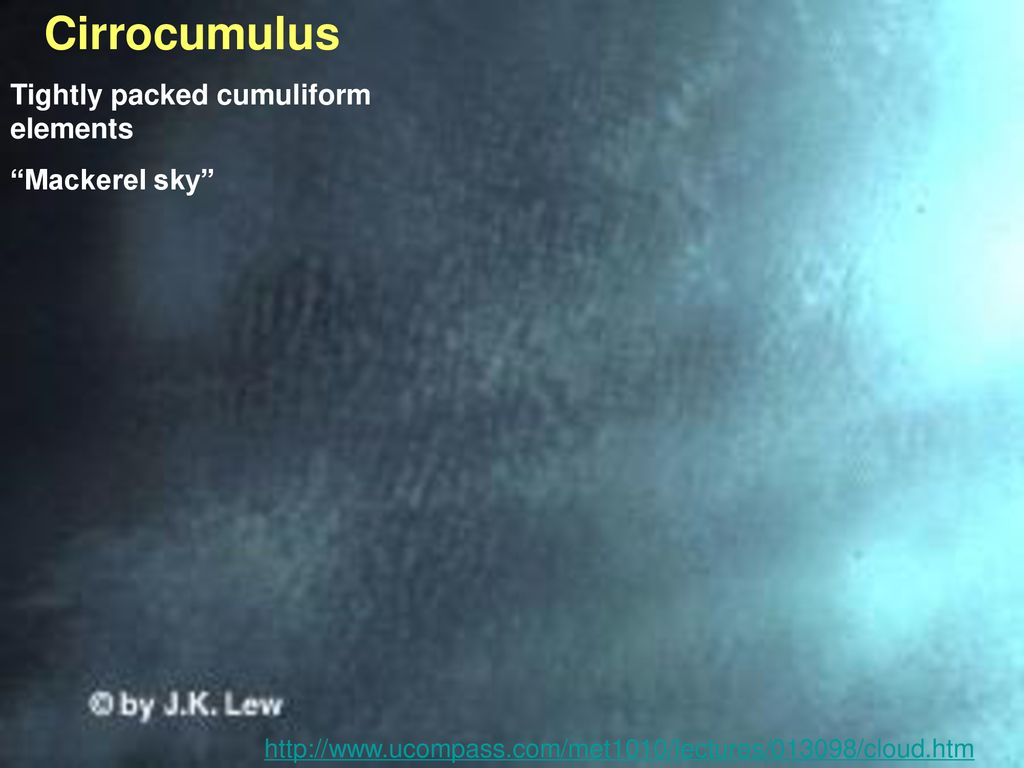
Cirrocumulus Tightly packed cumuliform elements “Mackerel sky”
49
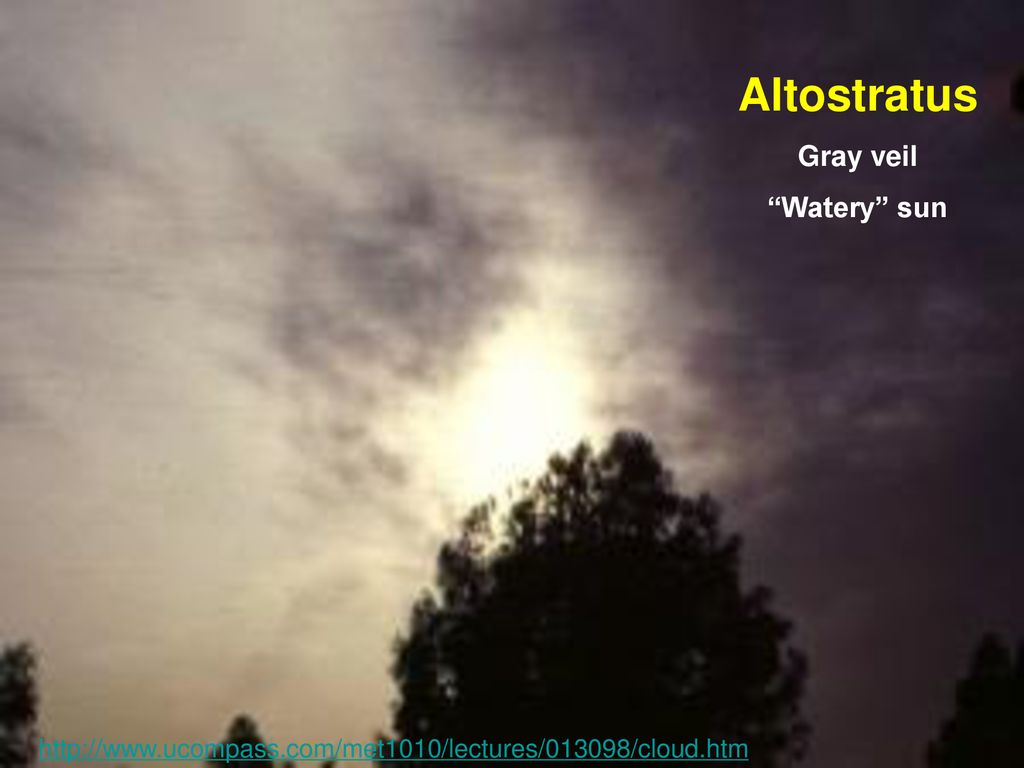
Altostratus Gray veil “Watery” sun
50
Composition: supercooled water and ice crystals Appearance: thick puff
Altocumulus Composition: supercooled water and ice crystals Appearance: thick puff

51
Stratus Composition: water droplets or ice Appearance: thick gray,
featureless layaer (overcast)
")
52
Stratocumulus Layer-like, but showing some cumuliform shape (flat blobs or rolls)
")
53
Thick, dark gray overcast with rain or snow
Nimbostratus Thick, dark gray overcast with rain or snow

54
Generally puffy clouds at low altitude
Cumulus Generally puffy clouds at low altitude

55
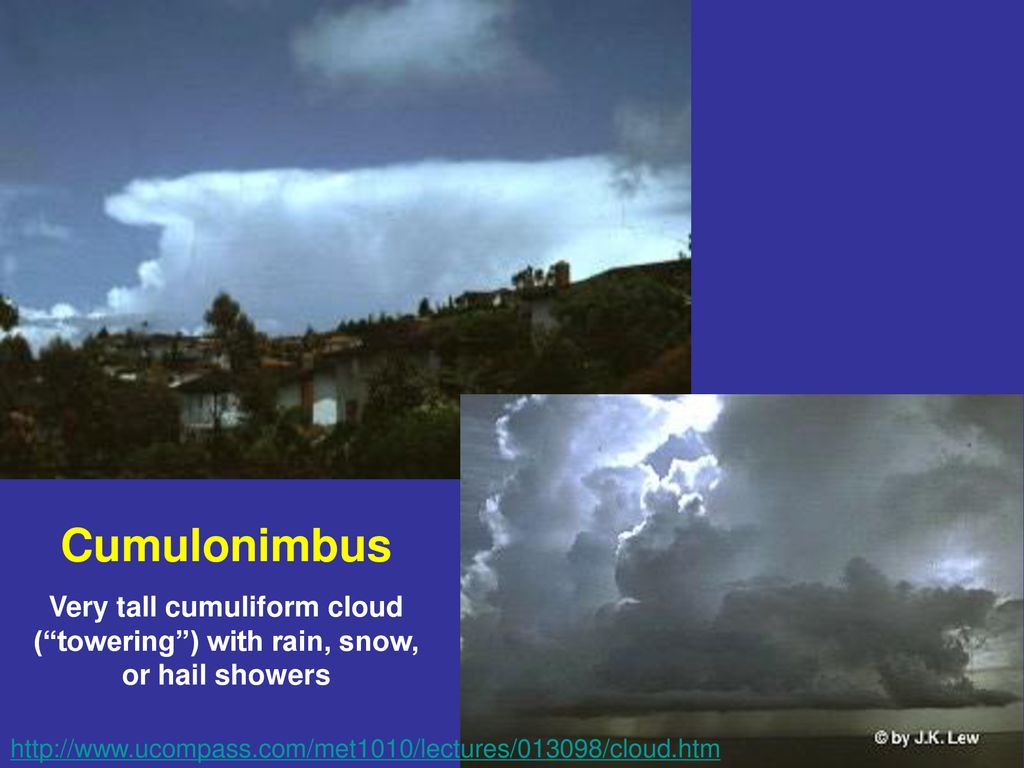
Cumulonimbus Very tall cumuliform cloud (“towering”) with rain, snow, or hail showers
61
การหมุนเวียนของระบบลมของโลก General Circulation
การไหลเวียนที่เกิดขึ้นในชั้นบรรยากาศและมหาสมุทรเกิดจากพลังงานความร้อน ที่โลกได้รับจากดวงอาทิตย์

62
พลังงานความร้อนจากดวงอาทิตย์ที่พื้นผิวโลกได้รับในแต่ละพื้นที่จะแตกต่างกัน โดยบริเวณขั้วโลกจะได้รับพลังงานแสงอาทิตย์น้อยกว่าบริเวณที่อยู่ในละติจูดที่ต่ำกว่า และในแถบศูนย์สูตรเป็นบริเวณที่ได้รับพลังงานจากดวงอาทิตย์สูงที่สุด พลังงานความร้อนที่พื้นผิวโลกได้รับแตกต่างกันจะขึ้นอยู่กับหลายตัวการ กล่าวคือ มุมที่รังสีดวงอาทิตย์ตกกระทบกับพื้นผิว การเอียงของแกนของโลกเป็นผลทำให้พื้นที่ในบริเวณขั้วโลกมีระยะเวลาในการรับรังสีจากดวงอาทิตย์เพียง 6 เดือนต่อปี พื้นที่ที่เป็นน้ำแข็ง เช่น อาร์คติก และ แอนตาร์คติก ทำให้มีการสะท้อนรังสีจากดวงอาทิตย์กลับคืนสู่อวกาศ

63
Radiation Budget at the top of the Earth’s Atmosphere
Source:

64
พิจารณาการไหลเวียนที่เกิดจากการยกตัวของอากาศเนื่องจากความร้อน (ไม่คิดการหมุนของโลก) “การไหลเวียนโดยคิดเป็นเซลเดียวกัน” การยกตัวของอากาศเนื่องจากความร้อนทำให้เกิดลักษณะการรวมตัวกันของมวลอากาศที่ยกตัวขึ้นในแนวตั้งของแต่ละซีกโลก มีการถ่ายเทพลังงานจากบริเวณเส้นศูนย์สูตรไปยังบริเวณขั้วโลกทั้งสอง Source:

65
ระบบการหมุนเวียนของบรรยากาศโลก
โลกมีสัณฐานเป็นทรงกลม โคจรรอบดวงอาทิตย์ 1 รอบ ใช้เวลา 1 ปี หากโลกหมุนไม่หมุนรอบตัวเอง บริเวณเส้นศูนย์สูตรของโลกจะเป็นแถบความกดอากาศต่ำ (อุณหภูมิสูง) เนื่องจากแสงอาทิตย์ตกกระทบเป็นมุมชัน ส่วนบริเวณขั้วโลกทั้งสองจะเป็นแถบความกดอากาศสูง (อุณหภูมิต่ำ) เนื่องจากแสงอาทิตย์ตกกระทบเป็นมุมลาด อากาศร้อนบริเวณศูนย์สูตรยกตัวขึ้น ทำให้อากาศเย็นบริเวณขั้วโลกเคลื่อนตัวเข้าแทนที่ เราเรียกการหมุนเวียนของอากาศทั้งสองซีกโลกว่า “แฮดเลย์เซลล์” (Hadley cell) ดังรูป
 เนื่องจากแสงอาทิตย์ตกกระทบเป็นมุมชัน ส่วนบริเวณขั้วโลกทั้งสองจะเป็นแถบความกดอากาศสูง (อุณหภูมิต่ำ) เนื่องจากแสงอาทิตย์ตกกระทบเป็นมุมลาด อากาศร้อนบริเวณศูนย์สูตรยกตัวขึ้น ทำให้อากาศเย็นบริเวณขั้วโลกเคลื่อนตัวเข้าแทนที่ เราเรียกการหมุนเวียนของอากาศทั้งสองซีกโลกว่า แฮดเลย์เซลล์ (Hadley cell) ดังรูป.")
66
อะไรทำให้เกิดความคลาดเคลื่อนเนื่องจากการไหลเวียนของเซลเดียว?
ผลจากการหมุนรอบตัวเองของโลกไม่ถูกนำมาคำนวณ การหมุนรอบตัวเองของโลกจะทำให้การเคลื่อนที่ของลมมีการหมุนเกิดขึ้น การหมุนรอบตัวเองของโลกจะทำให้ระบบในระดับสูงมีความเร็วสูงกว่าในระดับล่างและมีความเร็วเพิ่มขึ้นในบริเวณใกล้ขั้วโลก

67
รูปแบบการหมุนเวียนของลมเนื่องจากการหมุนรอบตัวเองของโลก
Source:

68
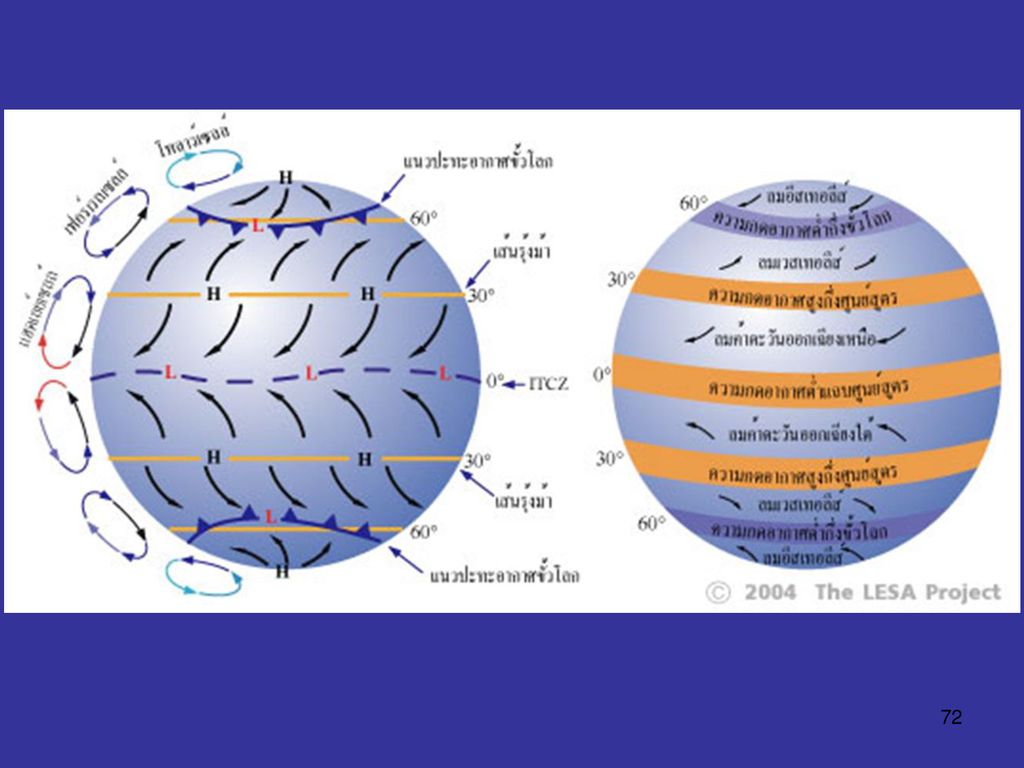
โลกหมุนรอบตัวเอง 1 รอบ ใช้เวลา 24 ชั่วโมง เซลล์การหมุนเวียนของบรรยากาศจึงแบ่งออกเป็น 3 เซลล์ ได้แก่ แฮดเลย์เซลล์ (Hadley cell), เฟอร์เรลเซลล์ (Ferrel cell) และ โพลาร์เซลล์ (Polar cell) ในแต่ละซีกโลก ดังภาพ
, เฟอร์เรลเซลล์ (Ferrel cell) และ โพลาร์เซลล์ (Polar cell) ในแต่ละซีกโลก ดังภาพ")
69
แถบความกดอากาศต่ำบริเวณเส้นศูนย์สูตร (Equator low)
เป็นเขตที่ได้รับความร้อนจากดวงอาทิตย์มากที่สุด กระแสลมค่อนข้างสงบ เนื่องจากอากาศร้อนชื้นยกตัวขึ้น ควบแน่นเป็นเมฆคิวมูลัสขนาดใหญ่ และมีการคายความร้อนแฝงจำนวนมาก ทำให้เป็นเกิดพายุฝนฟ้าคะนอง อากาศชั้นบนซึ่งสูญเสียไอน้ำไปแล้ว เคลื่อนตัวไปทางขั้วโลก

70
แถบความกดอากาศสูงกึ่งศูนย์สูตร (Subtropical high)
ที่บริเวณละติจูดที่ 30° เป็นเขตแห้งแล้ง เนื่องจากเป็นบริเวณที่อากาศแห้งจากแฮดลีย์เซลล์ และเฟอร์เรลเซลล์ ปะทะกันแล้วจมตัวลง ทำให้พื้นดินแห้งแล้งเป็นเขตทะเลทราย และพื้นน้ำมีกระแสลมอ่อนมาก เราเรียกเส้นละติจูดที่ 30° ว่า “เส้นรุ้งม้า” (horse latitudes) เนื่องจากเป็นบริเวณที่กระแสลมสงบ จนบางครั้งเรือใบไม่สามารถเคลื่อนที่ได้ ลูกเรือต้องโยนสินค้า ข้าวของ รวมทั้งม้าที่บรรทุกมาทิ้งทะเล อากาศเหนือผิวพื้นบริเวณเส้นรุ้งม้าเคลื่อนตัวไปยังแถบความกดอากาศต่ำบริเวณเส้นศูนย์สูตร ทำให้เกิด “ลมค้า” (Trade winds) แรงโคริออริสซึ่งเกิดจากการหมุนรอบตัวของโลกเข้ามาเสริม ทำให้ลมค้าทางซีกโลกเหนือเคลื่อนที่มาจากทิศตะวันออกเฉียงเหนือ และลมค้าทางซีกโลกใต้เคลื่อนที่มาจากทิศตะวันออกเฉียงใต้ ลมค้าทั้งสองปะทะชนกันและยกตัวขึ้นบริเวณเส้นศูนย์สูตร แถบความกดอากาศต่ำนี้จึงมีอีกชื่อหนึ่งว่า “แนวปะทะอากาศยกตัวเขตร้อน” หรือ “ITCZ” ย่อมาจาก Intertropic convection zone
 เนื่องจากเป็นบริเวณที่กระแสลมสงบ จนบางครั้งเรือใบไม่สามารถเคลื่อนที่ได้ ลูกเรือต้องโยนสินค้า ข้าวของ รวมทั้งม้าที่บรรทุกมาทิ้งทะเล อากาศเหนือผิวพื้นบริเวณเส้นรุ้งม้าเคลื่อนตัวไปยังแถบความกดอากาศต่ำบริเวณเส้นศูนย์สูตร ทำให้เกิด ลมค้า (Trade winds) แรงโคริออริสซึ่งเกิดจากการหมุนรอบตัวของโลกเข้ามาเสริม ทำให้ลมค้าทางซีกโลกเหนือเคลื่อนที่มาจากทิศตะวันออกเฉียงเหนือ และลมค้าทางซีกโลกใต้เคลื่อนที่มาจากทิศตะวันออกเฉียงใต้ ลมค้าทั้งสองปะทะชนกันและยกตัวขึ้นบริเวณเส้นศูนย์สูตร แถบความกดอากาศต่ำนี้จึงมีอีกชื่อหนึ่งว่า แนวปะทะอากาศยกตัวเขตร้อน หรือ ITCZ ย่อมาจาก Intertropic convection zone")
71
แถบความกดอากาศต่ำกึ่งขั้วโลก (Subpolar low)
ที่บริเวณละติจูดที่ 60° เป็นเขตอากาศยกตัว เนื่องจากอากาศแถบความกดอากาศสูงกึ่งศูนย์สูตร (H) เคลื่อนตัวไปทางขั้วโลก ถูกแรงโคริออริสเบี่ยงเบนให้เกิดลมพัดมาจากทิศตะวันตก เรียกว่า “ลมเวสเทอลีส์” (Westerlies) ปะทะกับ “ลมโพลาร์อีสเทอลีส์” (Polar easteries) ซึ่งพัดมาจากทิศตะวันออก โดยถูกแรงโคริออริสเบี่ยงเบนมาจากขั้วโลก มวลอากาศจากลมทั้งสองมีอุณหภูมิแตกต่างกันมาก ทำให้เกิด ”แนวปะทะอากาศขั้วโลก” (Polar front) มีพายุฝนฟ้าคะนอง อากาศชั้นบนซึ่งสูญเสียไอน้ำไปแล้ว เคลื่อนตัวไปยังจมตัวลงที่เส้นรุ้งม้า และบริเวณขั้วโลก
 เคลื่อนตัวไปทางขั้วโลก ถูกแรงโคริออริสเบี่ยงเบนให้เกิดลมพัดมาจากทิศตะวันตก เรียกว่า ลมเวสเทอลีส์ (Westerlies) ปะทะกับ ลมโพลาร์อีสเทอลีส์ (Polar easteries) ซึ่งพัดมาจากทิศตะวันออก โดยถูกแรงโคริออริสเบี่ยงเบนมาจากขั้วโลก มวลอากาศจากลมทั้งสองมีอุณหภูมิแตกต่างกันมาก ทำให้เกิด แนวปะทะอากาศขั้วโลก (Polar front) มีพายุฝนฟ้าคะนอง อากาศชั้นบนซึ่งสูญเสียไอน้ำไปแล้ว เคลื่อนตัวไปยังจมตัวลงที่เส้นรุ้งม้า และบริเวณขั้วโลก.")
73
ลักษณะการไหลเวียนของอากาศที่อยู่รอบโลก
Hadley cell (การยกตัวเนื่องจากการได้รับความร้อนโดยตรง) เป็นลักษณะการไหลเวียนที่มีการหมุนเวียนตามแนวเส้นแวงเนื่องจากความร้อน อากาศจะมีการยกตัวขึ้นบริเวณเส้นศูนย์สูตรและจมตัวใกล้กับเส้นรุ้ง ~ 30 องศา อธิบาย: ลมค้า (trade wind), ร่องความกดอากาศต่ำ (ITCZ) Ferrel Cell (การยกตัวเนื่องจากอิทธิพลทางอ้อมเนื่องจากความร้อน) เป็นลักษณะการเคลื่อนที่ของอากาศเนื่องจากพลังงานในรูปของโมเมนตัม อากาศจะมีการยกตัวขึ้นบริเวณใกล้กับเส้นรุ้ง ~ 60 องศา และจมตัวบริเวณเส้นรุ้ง ~ 30 องศา อธิบาย: ลมตะวันตกบริเวณเส้นรุ้ง องศา
 เป็นลักษณะการไหลเวียนที่มีการหมุนเวียนตามแนวเส้นแวงเนื่องจากความร้อน. อากาศจะมีการยกตัวขึ้นบริเวณเส้นศูนย์สูตรและจมตัวใกล้กับเส้นรุ้ง ~ 30 องศา. อธิบาย: ลมค้า (trade wind), ร่องความกดอากาศต่ำ (ITCZ) Ferrel Cell (การยกตัวเนื่องจากอิทธิพลทางอ้อมเนื่องจากความร้อน) เป็นลักษณะการเคลื่อนที่ของอากาศเนื่องจากพลังงานในรูปของโมเมนตัม. อากาศจะมีการยกตัวขึ้นบริเวณใกล้กับเส้นรุ้ง ~ 60 องศา และจมตัวบริเวณเส้นรุ้ง ~ 30 องศา. อธิบาย: ลมตะวันตกบริเวณเส้นรุ้ง องศา.")
74
ลมอ่อนใกล้กับเส้นศูนย์สูตร
Equator (doldrums) 30 degrees (horse latitudes) บริเวณที่อยู่ระหว่าง cold polar air and mid-latitude warmer air เรียกว่า polar front
 30 degrees (horse latitudes) บริเวณที่อยู่ระหว่าง cold polar air and mid-latitude warmer air เรียกว่า polar front.")
77
สรุป การเคลื่อนที่ของอากาศรอบโลก
ความแตกต่างของปริมาณรังสีแสงอาทิตย์ในแต่ละส่วนของโลกได้รับระหว่างขั้วโลก และ บริเวณศูนย์สูตร ทำให้เกิดการเคลื่อนที่เพื่อเป็นการถ่ายเทปริมาณความร้อนไปยังบริเวณขั้วโลก Hadley cell, เกิดจากการเคลื่อนตัวของอากาศที่อุ่นกว่าไปยังบริเวณขั้วโลก Ferrel cell เป็นการเคลื่อนที่เนื่องจากความร้อนและโมเมนตัมโดยการไหลเวียนของอากาศกลุ่มเล็ก ๆ (Eddy) ในซีกโลกเหนือ การไหลเวียนของอากาศจะมีทิศทางเวียนขวา และซีกโลกใต้จะหมุนในทางตรงกันข้าม Pole to pole Hadley cell is unstable in the presence of rotation rotation yields trade winds; surface westerlies in NH; upper tropospheric jets
 ในซีกโลกเหนือ การไหลเวียนของอากาศจะมีทิศทางเวียนขวา และซีกโลกใต้จะหมุนในทางตรงกันข้าม. Pole to pole Hadley cell is unstable in the presence of rotation. rotation yields trade winds; surface westerlies in NH; upper tropospheric jets.")
78
ระบบลมท้องถิ่น ลมท้องถิ่น (Local winds) เป็นลมซึ่งเกิดขึ้นในช่วงวัน คลอบคลุมพื้นที่ขนาดจังหวัด การหมุนเวียนของอากาศในสเกลระดับกลางเช่นนี้ เกิดขึ้นเนื่องจากสภาพภูมิศาสตร์และความแตกต่างของอุณหภูมิภายในท้องถิ่น ตัวอย่างเช่น ลมบก-ลมทะเล ลมภูเขา-ลมหุบเขา
 เป็นลมซึ่งเกิดขึ้นในช่วงวัน คลอบคลุมพื้นที่ขนาดจังหวัด การหมุนเวียนของอากาศในสเกลระดับกลางเช่นนี้ เกิดขึ้นเนื่องจากสภาพภูมิศาสตร์และความแตกต่างของอุณหภูมิภายในท้องถิ่น ตัวอย่างเช่น ลมบก-ลมทะเล ลมภูเขา-ลมหุบเขา.")
79
ลมบก – ลมทะเล เวลากลางวัน พื้นดินดูดกลืนความร้อนเร็วกว่าพื้นน้ำ อากาศเหนือพื้นดินร้อนและขยายตัวลอยสูงขึ้น (ความกดอากาศต่ำ) อากาศเหนือพื้นน้ำมีอุณหภูมิต่ำกว่า (ความกดอากาศสูง) จึงจมตัวและเคลื่อนเข้าแทนที่ ทำให้เกิดลมพัดจากทะเลเข้าสู่ชายฝั่ง เรียกว่า “ลมทะเล” (Sea breeze)
 อากาศเหนือพื้นน้ำมีอุณหภูมิต่ำกว่า (ความกดอากาศสูง) จึงจมตัวและเคลื่อนเข้าแทนที่ ทำให้เกิดลมพัดจากทะเลเข้าสู่ชายฝั่ง เรียกว่า ลมทะเล (Sea breeze)")
80
ลมบก – ลมทะเล เวลากลางคืน พื้นดินคลายความร้อนได้เร็วกว่าพื้นน้ำ อากาศเย็นเหนือพื้นดินจมตัวลง (ความกดอากาศสูง) และเคลื่อนตัวไปแทนที่อากาศอุ่นเหนือพื้นน้ำซึ่งยกตัวขึ้น (ความกดอากาศต่ำ) จึงเกิดลมพัดจากบกไปสู่ทะเล เรียกว่า “ลมบก” (Land breeze)
 และเคลื่อนตัวไปแทนที่อากาศอุ่นเหนือพื้นน้ำซึ่งยกตัวขึ้น (ความกดอากาศต่ำ) จึงเกิดลมพัดจากบกไปสู่ทะเล เรียกว่า ลมบก (Land breeze)")
81
ลมหุบเขา – ลมภูเขา เวลากลางวัน พื้นที่บริเวณไหล่เขาได้รับความร้อนมากกว่าบริเวณพื้นที่ราบหุบเขา ณ ระดับสูงเดียวกัน ทำให้อากาศร้อนบริเวณไหล่เขายกตัวลอยสูงขึ้น (ความกดอากาศต่ำ) เกิดเมฆคิวมูลัสลอยอยู่เหนือยอดเขา อากาศเย็นบริเวณหุบเขาเคลื่อนตัวเข้าแทนที่ จึงเกิดลมพัดจากเชิงเขาขึ้นสู่ลาดเขา เรียกว่า “ลมหุบเขา” (Valley breeze)
 เกิดเมฆคิวมูลัสลอยอยู่เหนือยอดเขา อากาศเย็นบริเวณหุบเขาเคลื่อนตัวเข้าแทนที่ จึงเกิดลมพัดจากเชิงเขาขึ้นสู่ลาดเขา เรียกว่า ลมหุบเขา (Valley breeze)")
82
ลมหุบเขา – ลมภูเขา หลังจากดวงอาทิตย์ตก พื้นที่ไหล่เขาสูญเสียความร้อน อากาศเย็นตัวอย่างรวดเร็ว จมตัวไหลลงตามลาดเขา เกิดลมพัดลงสู่หุบเขา เรียกว่า “ลมภูเขา” (Mountain breeze) ในบางครั้งกลุ่มอากาศเย็นเหล่านี้ปะทะกับพื้นดินในหุบเขาซึ่งยังมีอุณหภูมิสูงอยู่ จึงควบแน่นกลายเป็นหยดน้ำ ทำให้เกิดหมอก (Radiation fog)
 ในบางครั้งกลุ่มอากาศเย็นเหล่านี้ปะทะกับพื้นดินในหุบเขาซึ่งยังมีอุณหภูมิสูงอยู่ จึงควบแน่นกลายเป็นหยดน้ำ ทำให้เกิดหมอก (Radiation fog)")
83
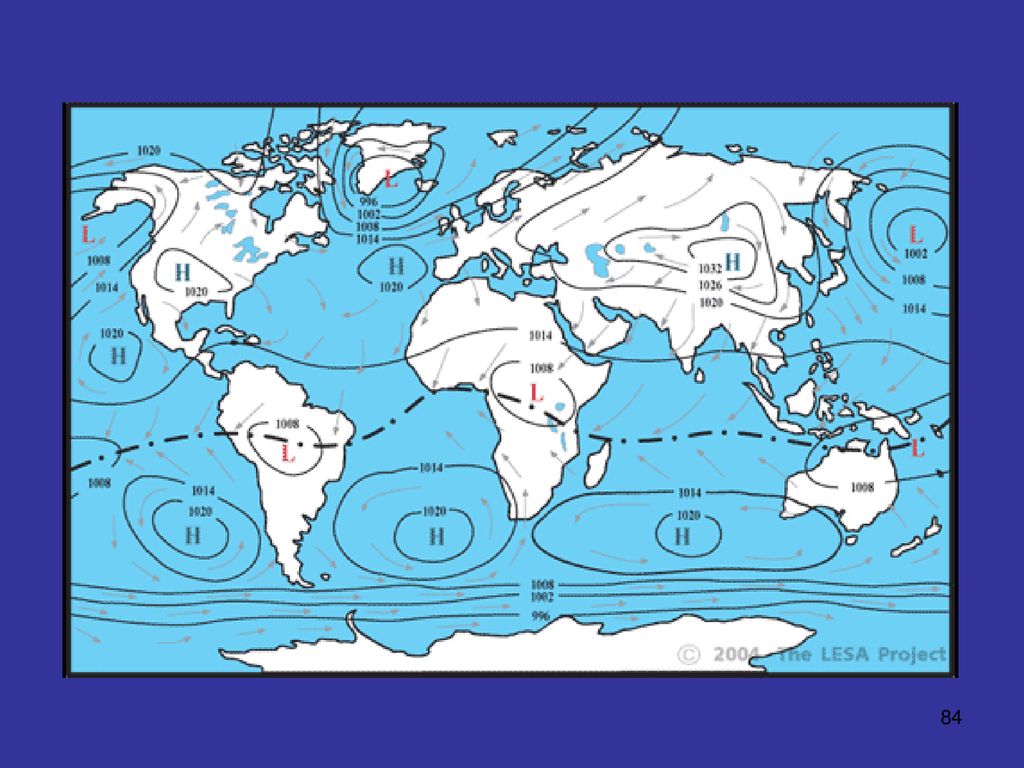
ปัจจัยที่มีอิทธิพลต่อลม
แรงเกรเดียนของความกดอากาศ (Pressure-gradiant force)พื้นผิวโลกแต่ละบริเวณได้รับพลังงานจากดวงอาทิตย์ไม่เท่ากัน พื้นที่ดังกล่าวจึงมีอุณหภูมิและความดันอากาศแตกต่างกันไป บนแผนที่อุตุนิยมจะมีเส้นแสดงความกดอากาศเท่ากัน เรียกว่า “ไอโซบาร์” (Isobars) เส้นไอโซบาร์แต่ละเส้นจะมีค่าความกดอากาศแตกต่างเท่าๆ กัน เช่น แตกต่างกันทุกๆ 6 มิลลิบาร์เป็นต้น (ภาพที่ 2) แรงเกรเดียนของความกดอากาศ = ความกดอากาศที่แตกต่าง / ระยะทางระหว่าง 2 ตำแหน่ง *ถ้าหากเส้นไอโซบาร์อยู่ใกล้ชิดกันแสดงว่า ความกดอากาศเหนือบริเวณนั้นมีความแตกต่างกันมาก หรือมีแรงเกรเดียนมาก แสดงว่ามีลมพัดแรง *แต่ถ้าเส้นไอโซบาร์อยู่ห่างกันแสดงว่า ความกดอากาศเหนือบริเวณนั้นมีความแตกต่างกันไม่มาก หรือมีแรงเกรเดียนน้อย แสดงว่ามีลมพัดอ่อน
พื้นผิวโลกแต่ละบริเวณได้รับพลังงานจากดวงอาทิตย์ไม่เท่ากัน พื้นที่ดังกล่าวจึงมีอุณหภูมิและความดันอากาศแตกต่างกันไป บนแผนที่อุตุนิยมจะมีเส้นแสดงความกดอากาศเท่ากัน เรียกว่า ไอโซบาร์ (Isobars) เส้นไอโซบาร์แต่ละเส้นจะมีค่าความกดอากาศแตกต่างเท่าๆ กัน เช่น แตกต่างกันทุกๆ 6 มิลลิบาร์เป็นต้น (ภาพที่ 2) แรงเกรเดียนของความกดอากาศ = ความกดอากาศที่แตกต่าง / ระยะทางระหว่าง 2 ตำแหน่ง. *ถ้าหากเส้นไอโซบาร์อยู่ใกล้ชิดกันแสดงว่า ความกดอากาศเหนือบริเวณนั้นมีความแตกต่างกันมาก หรือมีแรงเกรเดียนมาก แสดงว่ามีลมพัดแรง. *แต่ถ้าเส้นไอโซบาร์อยู่ห่างกันแสดงว่า ความกดอากาศเหนือบริเวณนั้นมีความแตกต่างกันไม่มาก หรือมีแรงเกรเดียนน้อย แสดงว่ามีลมพัดอ่อน.")
85
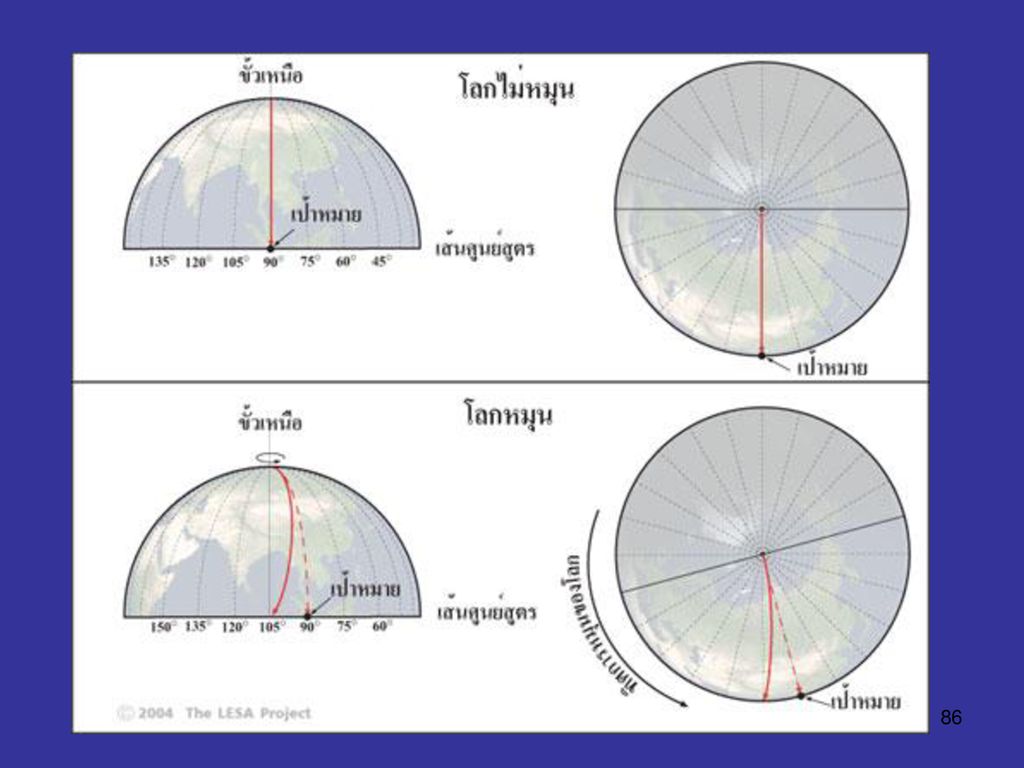
แรงโคริออริส (Coriolis)
เป็นแรงเสมือนซึ่งเกิดจากการที่โลกหมุนหมุนรอบตัวเอง ในภาพบน แสดงให้เห็นว่า หากโลกไม่หมุนรอบตัวเอง การยิงจรวดจากขั้วโลกเหนือไปยังเป้าหมายบนตำแหน่งที่เส้นศูนย์สูตรตัดกับเส้นแวงที่ 90° จะได้วิถีของจรวดเป็นเส้นตรง โดยสมมุติให้จรวดใช้เวลาเดินทางจากจุดปล่อยไปยังเป้าหมายใช้เวลาเดินทาง 1 ชั่วโมง ในภาพ ล่าง อธิบายถึงการเกิดแรงโคริออริส เนื่องจากโลกหมุนรอบตัวเอง 1 รอบใช้เวลา 24 ชั่วโมง เมื่อเวลาผ่านไปหนึ่งชั่วโมง นับตั้งแต่จรวดถูกปล่อยออกจากจุดปล่อยไปยังเป้าหมาย การหมุนของโลกทำให้วิถีของจรวดเป็นเส้นโค้ง และเคลื่อนไปตกบนเส้นแวงที่ 105° เนื่องจากหนึ่งชั่วโมงโลกหมุนไปได้ 15° (105° - 90° = 15°)
")
87
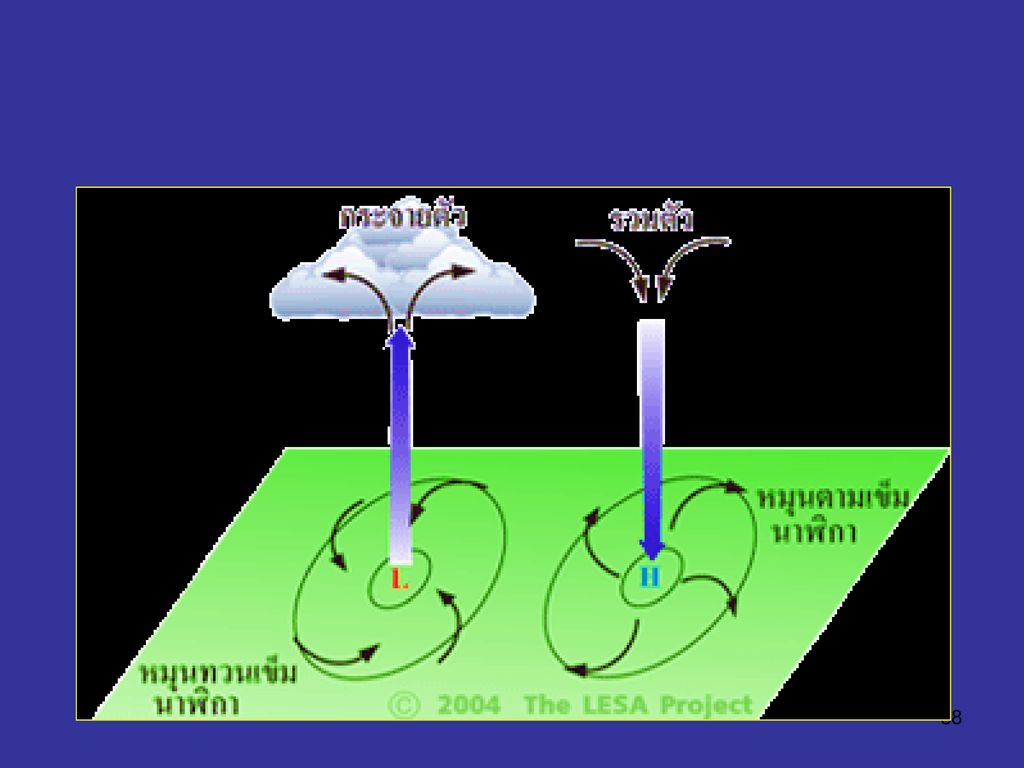
แรงโคริออริสไม่มีอิทธิพลต่อกระแสลมที่บริเวณเส้นศูนย์สูตร แต่จะมีอิทธิพลมากขึ้นในละติจูดที่สูงเข้าใกล้ขั้วโลก แรงโคริออริสทำให้ลมในซีกโลกเหนือเบี่ยงเบนไปทางขวา และทำให้ลมในซีกโลกใต้ เบี่ยงเบนไปทางซ้าย ภาพแสดงให้เห็นว่า ในบริเวณซีกโลกเหนือ แรงโคริออริสทำให้มวลอากาศรอบหย่อมความกดอากาศต่ำ (L) หรือ “ไซโคลน” (Cyclone) หมุนตัวทวนเข็มนาฬิกาเข้าสู่ศูนย์กลาง และมวลอากาศรอบหย่อมความกดอากาศสูง (H) “แอนติไซโคลน” (Anticyclone) หมุนตัวตามเข็มนาฬิกาออกจากศูนย์กลาง ในบริเวณซีกโลกใต้ “ไซโคลน” จะหมุนตัวตามเข็มนาฬิกา และ “แอนติไซโคลน” จะหมุนตัวทวนเข็มนาฬิกา ตรงกันข้ามกับซีกโลกเหนือ
 หมุนตัวตามเข็มนาฬิกาออกจากศูนย์กลาง ในบริเวณซีกโลกใต้ ไซโคลน จะหมุนตัวตามเข็มนาฬิกา และ แอนติไซโคลน จะหมุนตัวทวนเข็มนาฬิกา ตรงกันข้ามกับซีกโลกเหนือ.")
89
*แรงเสียดทาน (Friction) เป็นแรงที่เกิดจากความขรุขระของผิวโลก ทำให้เกิดความต้านทางการเคลื่อนที่ของอากาศ แรงเสียดทานมีอิทธิพลเฉพาะกับอากาศบริเวณใกล้พื้นผิว ซึ่งอยู่เหนือขึ้นไปเพียงไม่กี่กิโลเมตร แรงเสียดทานมีผลกระทบต่อความเร็วลม และก่อให้เกิดกระแสอากาศปั่นป่วน (Turbulence) ซึ่งมีปัจจัยควบคุม 3 ประการคือ *ความร้อนที่ผิวดิน ถ้าอากาศเหนือพื้นผิวร้อนมาก ก็จะทำให้เกิดกระแสอากาศปั่นป่วนอย่างรุนแรง (ในลักษณะเดียวกับน้ำเดือดในภาชนะ) *กระแสลม ถ้ากระแสลมแรง ก็จะทำให้เกิดกระแสอากาศปั่นป่วนอย่างรุนแรง * ลักษณะภูมิประเทศ บริเวณภูเขาและหุบเขา จะมีกระแสอากาศปั่นป่วนกว่าบริเวณที่เป็นพื้นราบ
 เป็นแรงที่เกิดจากความขรุขระของผิวโลก ทำให้เกิดความต้านทางการเคลื่อนที่ของอากาศ แรงเสียดทานมีอิทธิพลเฉพาะกับอากาศบริเวณใกล้พื้นผิว ซึ่งอยู่เหนือขึ้นไปเพียงไม่กี่กิโลเมตร แรงเสียดทานมีผลกระทบต่อความเร็วลม และก่อให้เกิดกระแสอากาศปั่นป่วน (Turbulence) ซึ่งมีปัจจัยควบคุม 3 ประการคือ *ความร้อนที่ผิวดิน ถ้าอากาศเหนือพื้นผิวร้อนมาก ก็จะทำให้เกิดกระแสอากาศปั่นป่วนอย่างรุนแรง (ในลักษณะเดียวกับน้ำเดือดในภาชนะ) *กระแสลม ถ้ากระแสลมแรง ก็จะทำให้เกิดกระแสอากาศปั่นป่วนอย่างรุนแรง * ลักษณะภูมิประเทศ บริเวณภูเขาและหุบเขา จะมีกระแสอากาศปั่นป่วนกว่าบริเวณที่เป็นพื้นราบ")
90
Air Mass Properties Air masses take on the properties of the underlying surface Air masses are classified according to their location of origin Geographical Characteristics Tropical, Polar, Arctic Surface Properties Maritime, continental Source region characteristics most prevalent if air mass remain over source region for a long period

91
Air Mass Classifications
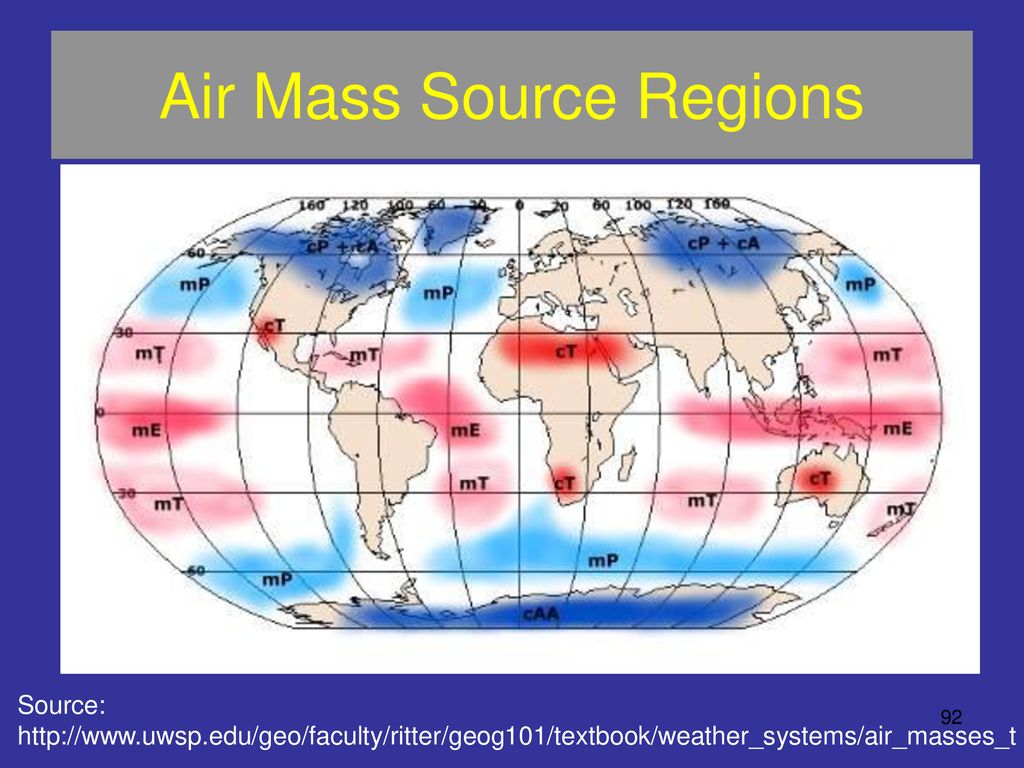
cP - continental Polar Cold, dry, stable mP - miritime Polar Cool, moist, unstable mT - maritime Tropical Warm, moist, usually unstable cT - continental Tropical Hot, dry Stable air aloft, unstable surface air

92
Air Mass Source Regions
93
The Pineapple Express brings heavy rain
Warm, moist mT air moves into California on Jan. 1, 1997 Heavy flooding caused 100,000 people to flee their homes Yesemite NP experienced nearly $200 million in damages and was closed for two months

94
Air mass characteristics can differ tremendously

95
Fronts A Front - is the boundary between air massed; normally refers to where this interface intersects the ground (in all cases except stationary fronts, the symbols are placed pointing to the direction of movement of the interface (front))
)")
96
Characteristics of Fronts
A cross the front - look for one more of the following: Change of Temperature Change of Moisture characteristic RH, Td Change of Wind Direction Change in direction of Pressure Gradient Characteristic Precipitation Patterns

97
How do we decide what kind of front it is?
From the vantage point of the ground, if warm air replaces colder air, the front is a warm front If cold air replaces warmer air, the front is a cold front If the front does not move, it is a stationary front Occluded fronts do not intersect the ground; the interface between the air masses is aloft

98
Typical Cold Front Structure
Cold air replaces warm; leading edge is steep in fast-moving front shown below due to friction at the ground Strong vertical motion an unstable air forms cumuliform clouds Upper level winds blow ice crystals downwind creating cirrus and cirrostratus Slower moving fronts have less steep boundaries and less vertically developed clouds may form if warm air is stable

99
Typical Warm Front Structure
In an advancing warm front, warm air rides up over colder air at the surface; slope is not usually very steep Lifting of the warm air produces clouds and precipitation well in advance of boundary At different point along the warm/cold air interface, the precipitation will experience different temperature histories as it falls to the ground

100
COLD FRONT WARM FRONT

101
Mid-latitude Cyclone Frontal Structure

102
Mature Wave Cyclone

103
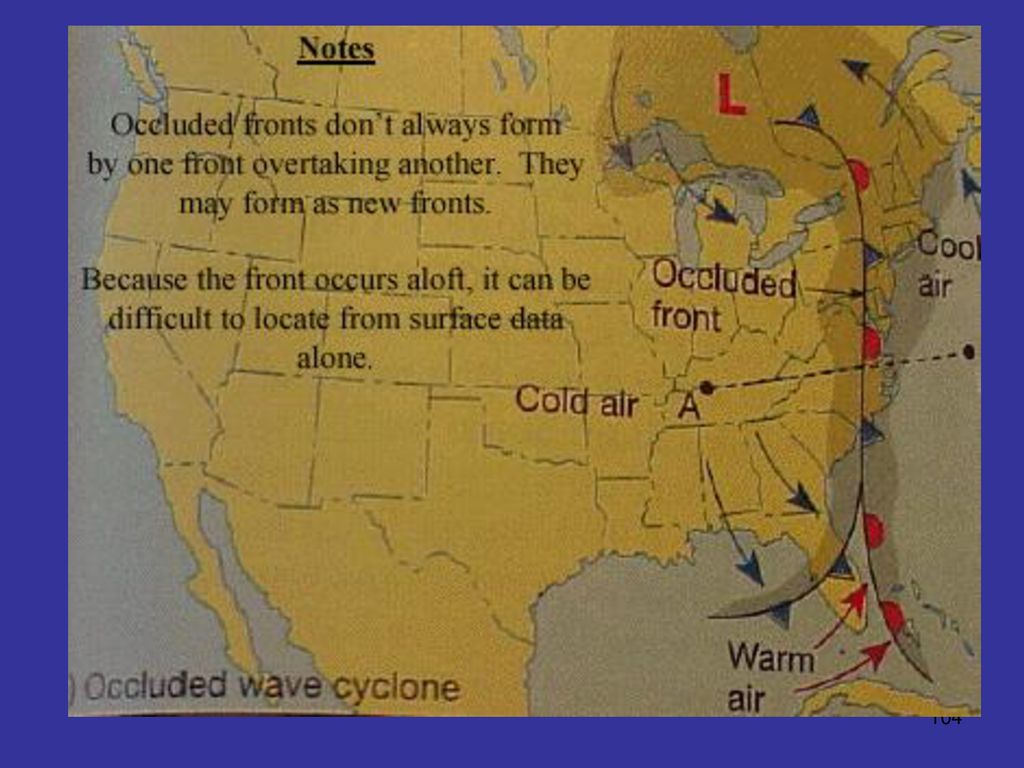
Partially occluded wave cyclone
Cold-occluded front Approach brings weather sequence like a warm front Frontal passage brings weather more like a cold front Warm-occluded fronts also possible

105
Scale of Motion Microscale : meters Mesoscale : km’s to 100’s of km’s
Turbulent eddies Formed by mechanical disturbance or convection Lifetimes of minutes Mesoscale : km’s to 100’s of km’s Local winds and circulaitons Land/sea breeze, mountain/valley winds, thunderstorm, tornadoes Lifetimes of minutesto hours Synoptic scale : 100’s to 1000’s of km’s Circulations around high and low pressure systems Lifetimes of days to weeks Global scale : systems ranging over entire globe

106
Sea and Land Breezes Sea and land breeze Sea breeze development
Mesoscale coastal winds Thermal circulations driven by differential heating/cooling of adjacent land and water surfaces Most prevalent when/where solar heating is strong Sea breeze development Solar heating raises land temperature more than water Air in contact with land warms and rises Cooler (denser) sea air move in to replace rising air over land Air sinking over the water in response to surface air movement, producing return circulation (land-to-sea breeze) aloft Sea breezes Cool coastal comunities Bring more humid air Haze Fog Often produce summer thunderstorms inland from the coast
 sea air move in to replace rising air over land. Air sinking over the water in response to surface air movement, producing return circulation (land-to-sea breeze) aloft. Sea breezes. Cool coastal comunities. Bring more humid air. Haze. Fog. Often produce summer thunderstorms. inland from the coast.")
107
Sea / Land breezes Covering gulf of Mexico and Atlantic sea breezes produce uplift and thunderstorm development in Florida Disruption of sea breezes reduces rainfall and can lead to a bad fire season Land breeze form at night due to stronger radiative cooling of the land surface leading to sinking and offshore flow of this cooler air mass with return flow aloft

108
The monsoon Monsoon winds are
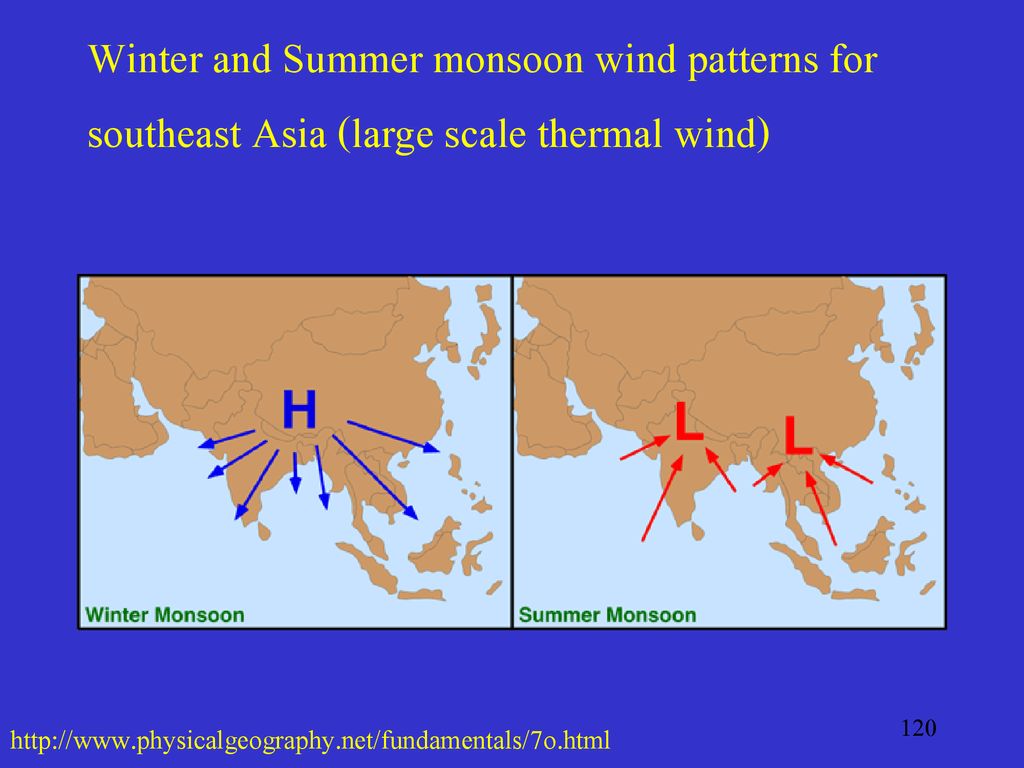
Seasonal Common in eastern and southern Asia Similar to huge land/sea breeze systems During winter strong cooling produces a shallow high pressure area over Siberia Subsidence, clockwise circulation and flow out from the high provide fair weather for southern and eastern Asia During summer, air over the continent heats and rises, drawing moist air in from the oceans Convergence and topography produce lifting and heavy rain formation

109
Mountain/Valley winds
Sunlight heats mountain slopes during the day and they cool by radiation at night Air in contact with surface is heated/cooled in response A difference in air density is produced between air next to the mountainside and air at the same altitude away from the mountain Density difference produces upslope (day) or downslope (night) flow Daily upslope/downslope wind cycle is strongest in clear summer weather when prevailing winds are light
 or downslope (night) flow. Daily upslope/downslope wind cycle is strongest in clear summer weather when prevailing winds are light.")
110
Dynamic process of the atmosphere

111
แรงต่าง ๆ ที่มีอิทธิพลต่อการเคลื่อนที่
CORIOLIS FORCE (เป็นฟังก์ชันของค่าละติจูด, ความเร็วของวัตถุ) PRESSURE GRADIENT FORCE (PGF) Pressure Gradient = (P2 – P1) / (X2 – x1) PGF: Pressure=Force/area => Force=area x pressure = volume x pressure gradient (pressure gradient is change in pressure per unit distance) => Force = (mass/density) x pressure gradient GRAVITY CENTIPITAL FORCE FRICTION
 PRESSURE GRADIENT FORCE (PGF) Pressure Gradient = (P2 – P1) / (X2 – x1) PGF: Pressure=Force/area => Force=area x pressure = volume x pressure gradient (pressure gradient is change in pressure per unit distance) => Force = (mass/density) x pressure gradient. GRAVITY. CENTIPITAL FORCE. FRICTION.")
112
Coriolis Force Objects, or parcels of air or water, moving relative to the Earth’s rotation (i.e. that we, as observers on the rotating Earth, see as moving) experience an additional centrifugal force. It is this force that is called the Coriolis Force. While the Coriolis force has the same mathematical form for northward and eastward motion the physical explanation is best presented differently:
 experience an additional centrifugal force. It is this force that is called the Coriolis Force. While the Coriolis force has the same mathematical form for northward and eastward motion the physical explanation is best presented differently:")
113
Geostrophic wind (NH) Vg
Geostrophic wind blows parallel to isobars or height contours Vg : steady-state wind blowing such that PGF is exactly balanced by Fcor Source:

114
Geostrophic balance

115
Thermal Wind Thermal Circulations
As discussed earlier, winds blow because of differences in atmospheric pressure. Pressure gradients may develop on a local to a global scale because of differences in the heating and cooling of the Earth's surface. Heating and cooling cycles that develop daily or annually can create several common local or regional thermal wind systems. The basic circulation system that develops is described in the generic illustrations below.

116
Thermal wind http://www.physicalgeography.net/fundamentals/7o.html
Cross-section of the atmosphere with uniform horizontal atmospheric pressure.

117
Thermal Circulation Atmospheric circulation caused by the heating and cooling of air.
Thermal High : Area of low pressure in the atmosphere caused by surface temperatures. Development of air flow in the upper atmosphere because of surface heating. Thermal Low : Area of high pressure in the atmosphere caused by surface temperatures. Development of a closed atmospheric circulation cell because of surface heating.

118
Daytime development of sea breeze
Nighttime development of land breeze

119
Daytime development of valley breeze
Nightime development of mountain breeze

120
Winter and Summer monsoon wind patterns for southeast Asia (large scale thermal wind)
121
The Gradient Wind When isobars are curved the geostrophic wind follows a curved path - the air/water is subject to a centrifugal force as well! The gradient wind for anticyclonic flow is stronger than the geostrophic wind but for cyclonic flow is weaker

122
Gradient Winds

123
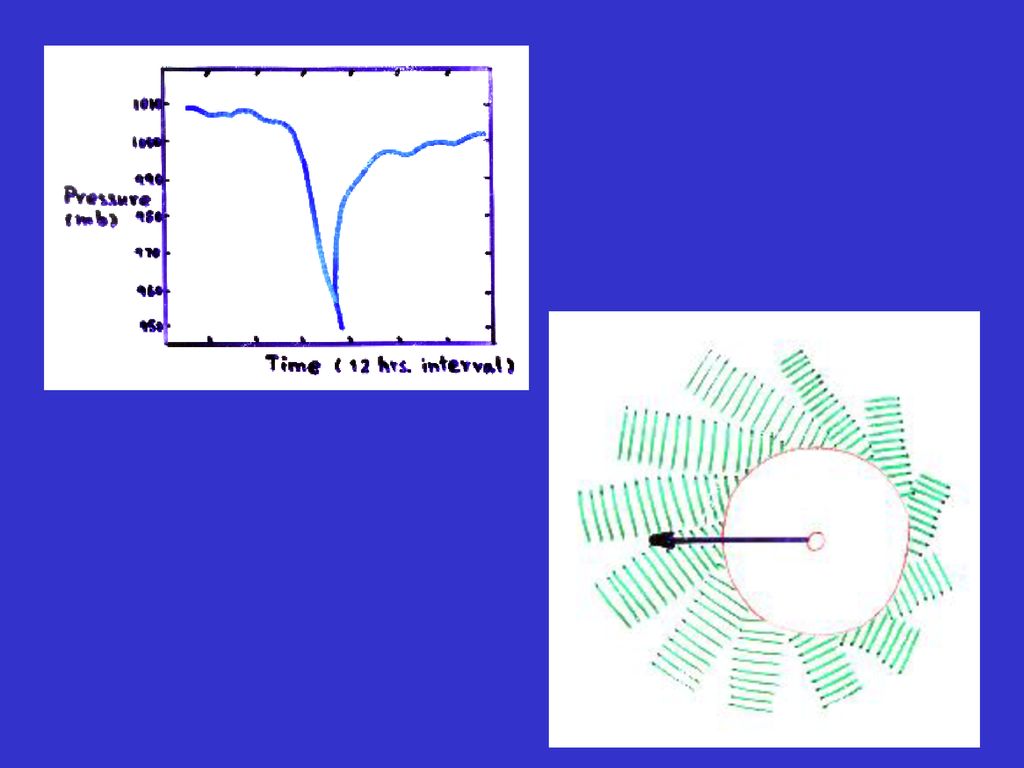
พายุหมุนเขตร้อน พายุหมุนเขตร้อน บริเวณที่มีลมพัดเวียนเข้าหาศูนย์ กลางของบริเวณ ความกดอากาศต่ำในระดับล่าง และมีลมพัดเวียนออกจากศูนย์กลาง ในระดับบน มีลักษณะอากาศที่รุนแรงเป็นบริเวณกว้าง ฝนหนัก ลมแรง พายุหมุนเขตร้อนมีแหล่งกำเนิดในทะเลเท่านั้น แต่อาจเคลื่อนตัว เข้าสู่แผ่นดินได้ แบ่งตามความเร็วลมได้ 3 ระดับ คือ DEPRESSION, TROPICAL STORM, และ TYPHOON หรือ HURRICANE หรือ CYCLONE

124
พายุหมุนเขตร้อน พายุหมุนเขตร้อน บริเวณที่มีลมพัดเวียนเข้าหาศูนย์ กลางของบริเวณ ความกดอากาศต่ำในระดับล่าง และมีลมพัดเวียนออกจากศูนย์กลาง ในระดับบน มีลักษณะอากาศที่รุนแรงเป็นบริเวณกว้าง ฝนหนัก ลมแรง พายุหมุนเขตร้อนมีแหล่งกำเนิดในทะเลเท่านั้น แต่อาจเคลื่อนตัว เข้าสู่แผ่นดินได้ แบ่งตามความเร็วลมได้ 3 ระดับ คือ DEPRESSION, TROPICAL STORM, และ TYPHOON หรือ HURRICANE หรือ CYCLONE

125
ประเภทของพายุหมุนเขตร้อน
DEPRESSION ความเร็วลมน้อยกว่า 61 กม./ชั่วโมง TROPICAL STORM ความเร็วลม กม./ชั่วโมง TYPHOON, HURRICANE, CYCLONE ความเร็วลมมากกว่า 119 กม./ชั่วโมงขึ้นไป TYPHOON บริเวณมหาสมุทรแปซิฟิกตะวันตก HURRICANE มหาสมุทรแปซิฟิกตะวันออก และแอตแลนติก CYCLONE มหาสมุทรอินเดีย

127
Left picture from the wonders of the weather by Bob Crowder

130
Tropical Cyclone

131
and the Southern Oscillation
El Nino, La Nina, and the Southern Oscillation

132
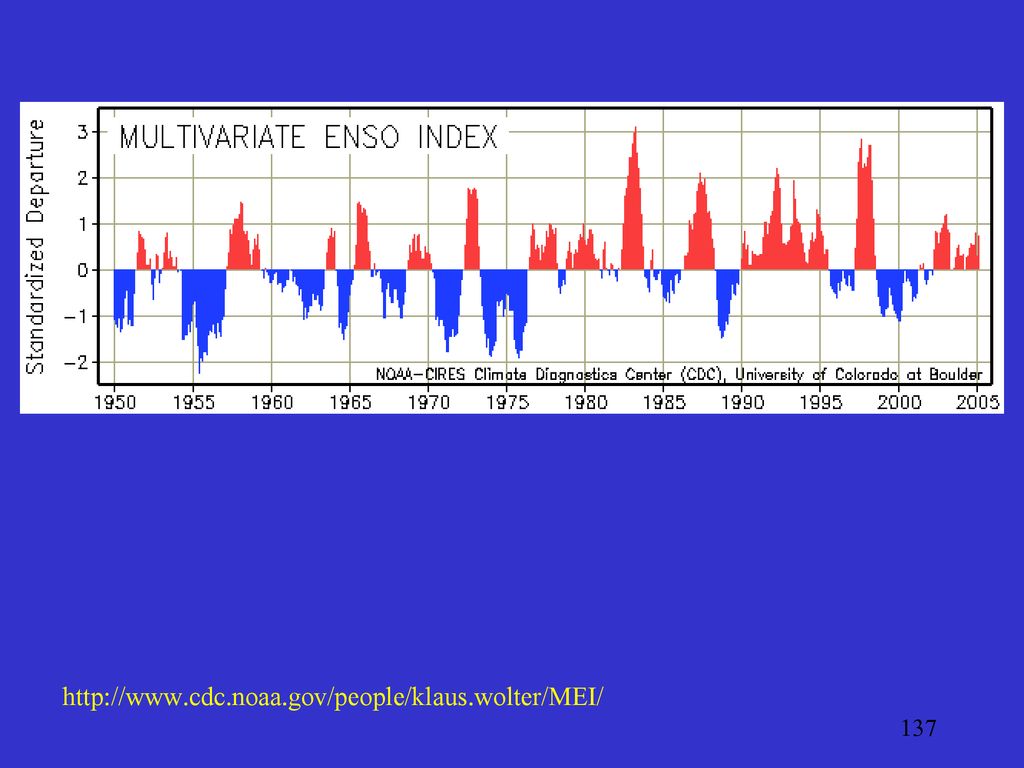
The Southern Oscillation
Before 1950, Scientists noted that an inverse relationship existed in the surface atmospheric pressure observations at Darwin, Australia and Tahiti. - As air pressure increased at Darwin, it decreased at Tahiti and vice versa. - The Southern Oscillation Index tracks these pressure changes. - SOI = PDarwin - PTahiti It was noted that during large positive values, Floods were common in Australia while Droughts occurred during large negative events. - Of main concern were the droughts which devastated crop production in Australia.

133
SOI and El Nino It was not until the 1960’s that the link between the SOI and El Nino was discovered. - It was theorized that Sea Surface Temperatures (SSTs) in the Equatorial Pacific waters increased beyond normal conditions during negative SOI periods. - These warmer SST values result in a disruption of normal surface pressure values as well as cloud and precipitation patterns. This Phenomena was also noted by Peruvian fisherman, and since it seemed to occur near the time of Christmas, they called it El Nino. - El Nino events led to reduced catches for the fisherman
 in the Equatorial Pacific waters increased beyond normal conditions during negative SOI periods. - These warmer SST values result in a disruption of normal surface pressure values as well as cloud and precipitation patterns. This Phenomena was also noted by Peruvian fisherman, and since it seemed to occur near the time of Christmas, they called it El Nino. - El Nino events led to reduced catches for the fisherman.")
134
The Impacts of El Nino Even though El Nino is a warming of water in the PacificOcean at the equator, the effects are GLOBAL. - Thus, a strong Perturbation in the ocean waters, leads to a local change in atmospheric pressure. - However, if the atmosphere is affected in one location, that sets off a “chain reaction” or “domino affect” which impacts weather patterns far removed from the originally affected area. - This phenomena is called Teleconnections. - This was graphically shown in the strong El Nino of

135
La Nina During the 1990’s scientists began to recognize that the unusually Cold Water events that also occurred also greatly affect global weather patterns. - Called La Nina in reference to El Nino, also called El Viejo (the cold). - These colder SST values also result in a disruption of normal surface pressure values as well as cloud and precipitation patterns. The impacts near and around the equator tend to be opposite of El Nino.
. - These colder SST values also result in a disruption of normal surface pressure values as well as cloud and precipitation patterns. The impacts near and around the equator tend to be opposite of El Nino.")
136
El Nino Southern Oscillation (ENSO)
Trade winds promote cold water upwelling in eastern tropical Pacific Cool, deep water is nutrient rich and supports rich ecosystem (plankton, fish, birds,…) Weaker trades lead to weaker upwelling. Warm nutrient-poor tropical water replaces the cold, nutrient-rich water. Every few years this El Nino (surface warming) persists and is widespread Huge ecosystem and economic losses Alters weather pattern over a large region
 Weaker trades lead to weaker upwelling. Warm nutrient-poor tropical water replaces the cold, nutrient-rich water. Every few years this El Nino (surface warming) persists and is widespread. Huge ecosystem and economic losses. Alters weather pattern over a large region.")
138
Surface water flow towards west Convection over western Pacific
Strong Trade Winds Surface water flow towards west Convection over western Pacific Warm Pool over western Pacific Cool SST’s over Northern South America and Southern US Coasts Weak Trade Winds Surface water flow toward east Convection shifts to central Pacific Warm Pool shifts to central Pacific Warm SST’s over Northern Southern America and Southern US Coasts Source:

139
Sea Surface Temperature
Anomalies

140
Why do we care about ENSO?
Global impacts on weather. Long timescale (months) yields improved seasonal predicition.
 yields improved seasonal predicition.")
141
Impacts of El Nino Droughts Extreme Precipitation
Fires Agricultural productivity Water supply Extreme Precipitation Floods Erosions Disease Impacts through marine food chain Natural ecological responses Economics

งานนำเสนอที่คล้ายกัน

>")


 ได้แก่ สถานะไอน้ำ เช่น เมฆ หมอก สถานะของเหลว ได้แก่ ฝน และน้ำค้าง และสถานะของแข็ง ได้แก่>")


.>")


.>")
