ดาวน์โหลดงานนำเสนอ
1
1 Control Chart for Attributes

2
Control Charts R Chart Variables Charts Attributes Charts X Chart P C Continuous Numerical Data Discrete Numerical Data Control Charts

3
3 Quality Characteristic Variable ( ข้อมูลที่ได้จากการ วัดที่เป็นค่าต่อเนื่อง เช่น ความหนา ) Attribute ( ข้อมูลที่ได้จากการนับ ที่เป็นไม่ต่อเนื่อง เช่น จำนวนของเสีย ) n>1? n>=10? x and MR no yes x and s x and R no yes Defective ( จำนวน ชิ้นงาน บกพร่อง ) Defect ( จำนวน ตำหนิบน ชิ้นงาน ) constant sample size? p no np yes constant sampling unit? c u yesno Control Chart Selection
 Defect ( จำนวน ตำหนิบน ชิ้นงาน ) constant sample size. p no np yes constant sampling unit. c u yesno Control Chart Selection.")
5
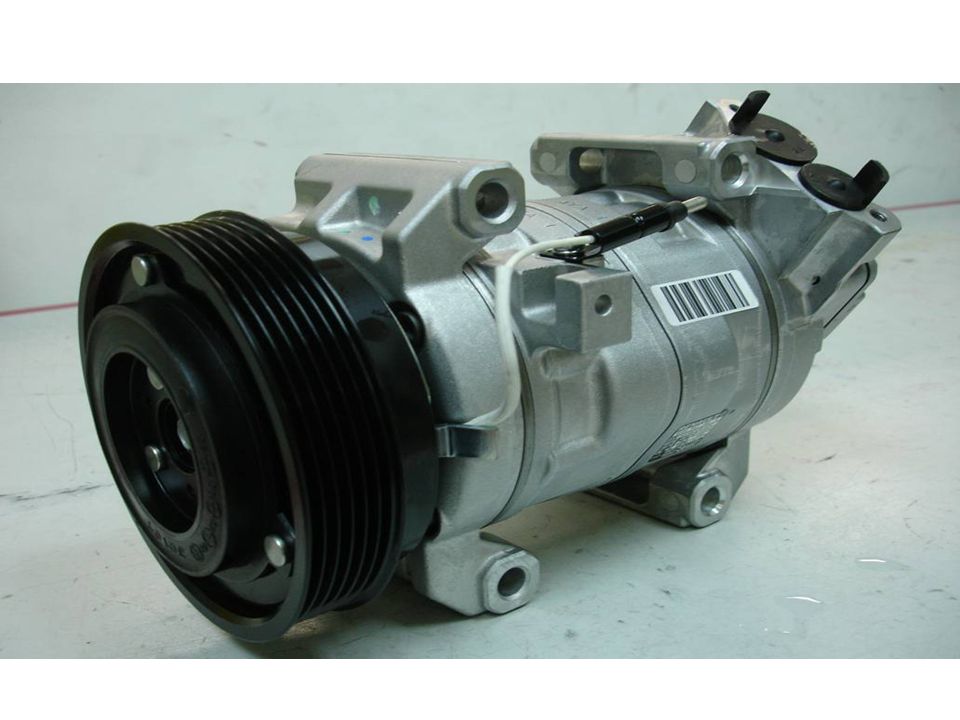
ปัญหาที่พบ ประเภทของปัญหา Warranty claim: Compressor เสียงดัง ลูกค้า xxx รุ่นรถยนต์ 2007 3.8L รุ่นผลิตภัณฑ์ x Compressor รหัสผลิตภัณฑ์ xxx-xxx

6
ปัญหาคืออะไร ในมุมมองของลูกค้าในมุมมองของบริษัท เกิดอะไรขึ้น Compressor มีเสียง Serial No: ABC อะไรคือสิ่งผิดปกติที่ เจอ ไม่พบแบริ่งหลังการประกอบ ทั้ง 2 ด้าน ทำไมจึงเป็น ปัญหา ทำให้เกิดความรำคาญชิ้นงานได้ถูกแก้ไข ภายในบริษัทหรือไม่ ไม่ เกิดขึ้นเมื่อไหร่ม. ค. 2552 จากการใช้จริง ม. ค. 2552 จากการแจ้งของ ลูกค้า ชิ้นงานถูกผลิต เมื่อไหร่ ธ. ค. 2551 กะดึก 02:00 AM ใครเจอปัญหา ลูกค้า ถูกผลิตโดยใคร คุณก. พนง. ประกอบแบริ่ง เจอที่ไหน USA ชิ้นงานใช้ร่วมกันกับ งานอื่นหรือไม่ Compressor ใช้เฉพาะรุ่น DC แต่ทุกรุ่นใช้แบริ่ง 2 ลูก เจอได้อย่างไร เมื่อลองขับเปิดแอร์ (Rpm > 2000) เมื่อส่งชิ้นงานเข้า กระบวนการอีกครั้ง สามารถตรวจจับได้ หรือไม่ สามารถตรวจจับได้โดย ขั้นตอนตรวจสอบแบริ่ง ก่อน สวมอัด ทั้งหมดกี่ชิ้น 1 ชิ้น ใช้งานไป 3,961 ไมล์มีปัญหาที่คล้ายคลึง กันเกิดขึ้นมาก่อน หรือไม่ เกิดขึ้น 1 ครั้งในปี 2549 ที่ ไลน์ C แต่ไม่มีประวัตี
 เมื่อส่งชิ้นงานเข้า กระบวนการอีกครั้ง สามารถตรวจจับได้ หรือไม่ สามารถตรวจจับได้โดย ขั้นตอนตรวจสอบแบริ่ง ก่อน สวมอัด ทั้งหมดกี่ชิ้น 1 ชิ้น ใช้งานไป 3,961 ไมล์มีปัญหาที่คล้ายคลึง กันเกิดขึ้นมาก่อน หรือไม่ เกิดขึ้น 1 ครั้งในปี 2549 ที่ ไลน์ C แต่ไม่มีประวัตี.")
7
Good and Bad part GOOD PART BAD PART

8
ลักษณะปัญหาที่พบ จุดที่เกิดปัญหา แบริ่ง กระบอกสูบ

9
กิจกรรมการคัดแยกของเสีย Sorting น้ำหนักของ NG part = น้ำหนักของ OK part – 20 g ( น้ำหนักของแบริ่ง 2 ตัว =20g) จากค่าชี้บ่งคลื่นความถี่วิทยุ (RFID : Radio Frequency Identification) น้ำหนัก ของ น้ำหนัก NG part weight = 6036 g. จากการตรวจสอบความสามารถของน้ำหนักของโมเดลนี้ทำให้เราสามารถตรวจจับ NG part ได้ NG compressor 6036g out of specification New specification เราสามารถเลือกบันทึกค่าน้ำหนักจาก RFID data โดยการปรับสเปค ( สเปคเดิม : 6015-6115g ; สเปคใหม่ : 6055-6125g) Old specification NG compressor 6036g in specification กระบวนการคัดแยกโดยการตรวจสอบน้ำหนักของคอมเพรสเซอร์จากข้อมูล RFID
 Old specification NG compressor 6036g in specification กระบวนการคัดแยกโดยการตรวจสอบน้ำหนักของคอมเพรสเซอร์จากข้อมูล RFID.")
10
10 Types of Attribute Charts: 1.Nonconforming Units or defectives (based on the Binomial distribution): p chart, np chart. p chart: สำหรับข้อมูลที่แสดงสัดส่วนของผลิตภัณฑ์ บกพร่องโดยจำนวนหน่วยข้อมูลแต่ละกลุ่มย่อยที่ใช้ ตรวจไม่จำเป็นต้องคงที่ np chart: สำหรับข้อมูลที่แสดงจำนวนของผลิตภัณฑ์ บกพร่องโดยจำนวนหน่วยข้อมูลแต่ละกลุ่มย่อยที่ใช้ ตรวจจำเป็นต้องคงที่หรือเท่ากัน 2.Nonconformities or defects (based on the Poisson distribution): u chart, c chart. u chart : สำหรับข้อมูลที่แสดงสัดส่วนข้อบกพร่อง หรือตำหนิบนผลิตภัณฑ์ โดยหน่วยที่ใช้ในการ ตรวจสอบไม่จำเป็นต้องคงที่ เช่น รอยตำหนิบนผืนผ้า c chart : สำหรับข้อมูลที่แสดงจำนวนของผลิตภัณฑ์ บกพร่องโดยหน่วยที่ใช้ในการตรวจสอบต้องคงที่หรือ เท่ากัน เช่น รอยตำหนิบนผืนผ้า ในพื้นที่ 1 ตาราง เมตร Attribute
: u chart, c chart. u chart : สำหรับข้อมูลที่แสดงสัดส่วนข้อบกพร่อง หรือตำหนิบนผลิตภัณฑ์ โดยหน่วยที่ใช้ในการ ตรวจสอบไม่จำเป็นต้องคงที่ เช่น รอยตำหนิบนผืนผ้า c chart : สำหรับข้อมูลที่แสดงจำนวนของผลิตภัณฑ์ บกพร่องโดยหน่วยที่ใช้ในการตรวจสอบต้องคงที่หรือ เท่ากัน เช่น รอยตำหนิบนผืนผ้า ในพื้นที่ 1 ตาราง เมตร Attribute.")
11
Formula: The fraction nonconforming, p, is usually small, say, 0.10 or less. Because the fraction nonconforming is very small, the subgroup sizes must be quite large to produce a meaningful chart. The P Chart

12
It can be used to control one quality characteristic, as is done with X bar and R chart, Or to control a group of quality characteristics of the same type or of the same part, Or to control the entire product. It can be established to measure the quality produced by a work center, by a department, by a shift, or by an entire plant. The P Chart

13
It is frequently used to report the performance of an operator, group of operators, or management as a means of evaluating their quality performance. The subgroup size of the P chart can be either variable or constant. The P Chart

14
Objectives of the P Chart: 1.Determine the average quality level: This information provides the process capability in terms of attributes. 2.Bring to the attention of management any changes in the average. 3.Improve the product quality: Ideas for quality improvement. The P Chart

15
Objectives of the P Chart cont’d: 4.Evaluate the quality performance of operating and management personnel. 5.Suggest places to use X bar and R chart: They are more sensitive to variation. 6.Determine acceptance criteria of a product before shipment to the customer. The P Chart

16
P-Chart Construction for Constant Subgroup Size 1.Select the quality characteristic(s): a)Single quality characteristic. b)Group of quality characteristics. c)A part. d)An entire product. e)A number of products. f)It can be established for performance control of an operator, work center, department, shift, plant, or corporation The P Chart
Group of quality characteristics. c)A part. d)An entire product. e)A number of products. f)It can be established for performance control of an operator, work center, department, shift, plant, or corporation The P Chart.")
17
P Chart Construction for Constant Subgroup Size. 2.Determine the subgroup size and method: The size of the subgroup is a function of the proportion nonconforming. A minimum size of 50 is suggested as a starting point. The P Chart

18
P Chart Construction for Constant Subgroup Size. 3.Collect the data: At least 25 subgroups. Different sources (Check sheet). For each subgroup the proportion nonconforming is calculated by the formula P = np/n The P Chart
. For each subgroup the proportion nonconforming is calculated by the formula P = np/n The P Chart.")
19
P Chart Construction for Constant Subgroup Size. 4.Calculate the trial central line and the control limits: The P Chart

20
P Chart Construction for Constant Subgroup Size cont’d. 5.Establish the revised central line and control limits. The P Chart

21
P Chart Construction for Variable Subgroup Size 1.Collect the data. 2.Determine the trial central line and control limits: Since the subgroup size changes each day, limits must be calculated for each day. The P Chart

22
P Chart Construction for Variable Subgroup Size. 2.As the subgroup size gets larger, the control limits are closer together. 3.Establish revised central line and control limits: The P Chart

23
Minimizing the Effect of Variable Subgroup Size 1.Control limits for an average subgroup size: By using an average subgroup size, one limit can be calculated and placed on the control chart. The P Chart

24
Minimizing the Effect of Variable Subgroup Size cont’d. Case I: This case occurs when a point (subgroup fraction nonconforming) falls inside the limits and its subgroup size is smaller than the average subgroup size. Case II: This case occurs when a point (subgroup fraction nonconforming) falls inside the average limits and its subgroup size is larger than the average subgroup size. The P Chart
 falls inside the limits and its subgroup size is smaller than the average subgroup size. Case II: This case occurs when a point (subgroup fraction nonconforming) falls inside the average limits and its subgroup size is larger than the average subgroup size. The P Chart.")
25
Minimizing the Effect of Variable Subgroup Size cont’d. Case III: This case occurs when a point (subgroup fraction nonconforming) falls outside the limits and its subgroup size is larger than the average subgroup size. Case IV: This case occurs when a point (subgroup fraction nonconforming) falls outside limits and its subgroup size is less than the average subgroup size.
 falls outside the limits and its subgroup size is larger than the average subgroup size. Case IV: This case occurs when a point (subgroup fraction nonconforming) falls outside limits and its subgroup size is less than the average subgroup size..")
26
Number Nonconforming Chart (np): The np chart is easier for operating personnel to understand than the p chart. The limitation that this chart has is that the subgroup size needs to be constant. The np Chart

27
Number Nonconforming Chart (np): If the fraction nonconforming p o is unknown, then it must be determine by collecting data, calculating trial control limits, and obtaining the best estimate of p o. The np Chart

28
For an attribute this process is much simpler. The process capability is the central line of the control chart. Management is responsible for the capability. When the plotted point is outside the control limit, operating personnel are usually responsible. Process Capability

29
Control chart (example 1) Fraction defective for electric machine part
 Fraction defective for electric machine part")
30
Control chart (example 2) The data of electroplating part defectives, the sample size = 100 UCL = 10.39 LCL = 0
 The data of electroplating part defectives, the sample size = 100 UCL = LCL = 0")
31
Control chart (example 2)
")


>")

 within the product or service. An item is classified as a.>")

