ดาวน์โหลดงานนำเสนอ
งานนำเสนอกำลังจะดาวน์โหลด โปรดรอ

1
Chapter 3 Design of Discrete-Time control systems Frequency Response

2
Outline 1 Concept of frequency response 2 Bode diagram

3
Concept of Frequency Response
Sinusoidal frequency response: a. system; b. transfer function; c. input and output waveforms

4
System with sinusoidal input
𝑅 𝑠 = 𝐴ω 𝑠 2 + ω 2 𝑟 𝑡 =𝐴𝑠𝑖𝑛 ω𝑡 System with sinusoidal input

5
𝐺 𝑠 = 𝑖=1 𝑀 𝑠+ 𝑧 𝑖 𝑗=1 𝑁 𝑠+ 𝑝 𝑗 𝐶 𝑠 =𝐺 𝑠 𝐴 ω 𝑠 2 + ω 2 𝐺 𝑗ω = 𝑖=1 𝑀 𝑧 𝑖 +𝑗ω 𝑗=1 𝑁 𝑝 𝑗 +𝑗ω =∣𝐺 𝑗ω ∣ e 𝑗φ φ=arctan ℑ 𝐺 𝑗ω ℜ 𝐺 𝑗ω

6
ω𝐴 𝑠 2 + ω 2 𝐺 𝑠 = 𝑎 1 𝑠+𝑗ω + 𝑎 2 𝑠−𝑗ω +...
𝑎 1 = ω𝐴 𝑠−𝑗ω 𝑠=−𝑗ω = −𝐴 2j 𝐺 −𝑗ω 𝑎 2 = ω𝐴 𝑠+𝑗ω 𝑠=𝑗ω = 𝐴 2j 𝐺 𝑗ω

7
𝐶 𝑠 =− 𝐴 2j 1 𝑠+𝑗ω 𝐺 −𝑗ω + 𝐴 2j 1 𝑠−𝑗ω 𝐺 𝑗ω
𝐺 𝑗ω =∣𝐺 𝑗ω ∣ e 𝑗φ 𝐺 −𝑗ω =∣𝐺 −𝑗ω ∣ e −𝑗φ =∣𝐺 𝑗ω ∣ e −𝑗φ 𝑐 𝑡 = 𝐴 2j ∣𝐺 𝑗ω ∣ − e −𝑗ω𝑡 e −𝑗φ + e 𝑗ω𝑡 e 𝑗φ =𝐴∣𝐺 𝑗ω ∣ e 𝑗 ω𝑡+φ − e −𝑗 ω𝑡+φ 2j

8
จากสมการจะเห็นได้ว่าเอาต์พุตของระบบเชิงเส้น
𝑐 𝑡 =𝐴∣𝐺 𝑗ω ∣sin ω𝑡+φ จากสมการจะเห็นได้ว่าเอาต์พุตของระบบเชิงเส้น (Linear system) จะมีขนาด(Gain) และ มุมเฟสที่ เปลี่ยนไปจากอินพุต
 จะมีขนาด(Gain) และ มุมเฟสที่ เปลี่ยนไปจากอินพุต.")
9
Bode Diagram Bode Diagram
1. Gain diagram – Plot between gain (dB) and frequency on semi-log diagram. 2. Phase diagram – Plot between phase (degree or radian) and frequency on semi-log diagram. 𝐺 𝑠 = 𝐾 𝑠 𝑘 𝑖=1 𝑀 𝑠+ 𝑧 𝑖 𝑗=1 𝑁 𝑠+ 𝑝 𝑗
 and frequency. on semi-log diagram. 2. Phase diagram – Plot between phase (degree or radian) and frequency on semi-log diagram. 𝐺 𝑠 = 𝐾 𝑠 𝑘 𝑖=1 𝑀 𝑠+ 𝑧 𝑖 𝑗=1 𝑁 𝑠+ 𝑝 𝑗.")
10
Gain diagram 𝑑𝐵=20log∣𝐺 𝑗ω ∣
∣𝐺 𝑗ω ∣= 𝐾∣𝑗ω+ 𝑧 1 ∣...∣𝑗ω+ 𝑧 𝑀 ∣ ∣ 𝑗ω 𝑘 ∣∣𝑗ω+ 𝑝 1 ∣...∣𝑗ω+ 𝑝 𝑁 ∣ 𝑑𝐵=20log 𝐾 +20log 𝑧 ω log 𝑧 𝑀 2 + ω 2 −20log ω 𝑘 −20log 𝑝 ω 2 −...−20log 𝑝 𝑁 2 + ω 2

11
Phase diagram ∡𝐺 𝑗ω =∡ 𝑗ω+ 𝑧 ∡ 𝑗ω+ 𝑧 𝑀 −∡ 𝑗ω+ 𝑝 1 −...−∡ 𝑗ω+ 𝑝 𝑁 φ 1 =∡ 𝑠+ 𝑧 1 =arctan 𝑗ω 𝑧 1 ⋮⋮ φ 𝑀 =∡ 𝑠+ 𝑧 𝑀 =arctan 𝑗ω 𝑧 𝑀

12
θ 1 =∡ 𝑠+ 𝑝 1 =arctan 𝑗ω 𝑝 1 ⋮⋮ θ 𝑁 =∡ 𝑠+ 𝑝 1 =arctan 𝑗ω 𝑝 𝑁

13
การพล๊อตนั้นจะทำอยู่ในช่วงความถี่() ที่จะทำการศึกษา
𝑑𝐵=20log 𝐾 +20log 𝑧 ω log 𝑧 𝑀 2 + ω 2 −2olog ω 𝑘 −20log 𝑝 ω 2 −20log 𝑝 𝑁 2 + ω 2 ∡𝐺 𝑗ω = φ φ 𝑀 − θ 1 −...− θ 𝑁 การพล๊อตนั้นจะทำอยู่ในช่วงความถี่() ที่จะทำการศึกษา
 ที่จะทำการศึกษา.")
14
Frequency response plots for G(s) =1/(s +2)
: separate magnitude and phase

15
Asymptotic Approximation
Bode plots of (s + a) : a. magnitude plot b. phase plot.
 : a. magnitude plot b. phase plot.")
16
Asymptotic and actual normalized and scaled magnitude response of (s + a)
")
17
Asymptotic and actual normalized and scaled phase response of (s +a)
")
18
Normalized and scaled Bode plots for
a. G(s) = s; b. G(s) = 1/s;
 = s; b. G(s) = 1/s;")
19
Normalized and scaled Bode plots for
c. G(s) = (s + a); d. G(s) = 1/(s + a)
 = (s + a); d. G(s) = 1/(s + a)")
20
Example (Nise) Draw the Bode plot for
the system shown below 𝐺 𝑠 = 𝐾 𝑠+3 𝑠 𝑠+1 𝑠+2

21
Bode log- magnitude plot :
a. components; b. composite

22
Bode phase plot a. components; b. composite

23
Normalized and scaled log-magnitude response for

24
Scaled phase response for

25
Normalized and scaled log magnitude
response for

26
Scaled phase response for

27
Bode magnitude plot for G(s) = (s + 3)/[(s + 2) (s2 + 2s + 25)]:
a. components; b. composite
![Bode magnitude plot for G(s) = (s + 3)/[(s + 2) (s2 + 2s + 25)]:](http://slideplayer.in.th/slide/13856021/85/images/27/Bode+magnitude+plot+for+G%28s%29+%3D+%28s+%2B+3%29%2F%5B%28s+%2B+2%29+%28s2+%2B+2s+%2B+25%29%5D%3A.jpg "a. components; b. composite.")
28
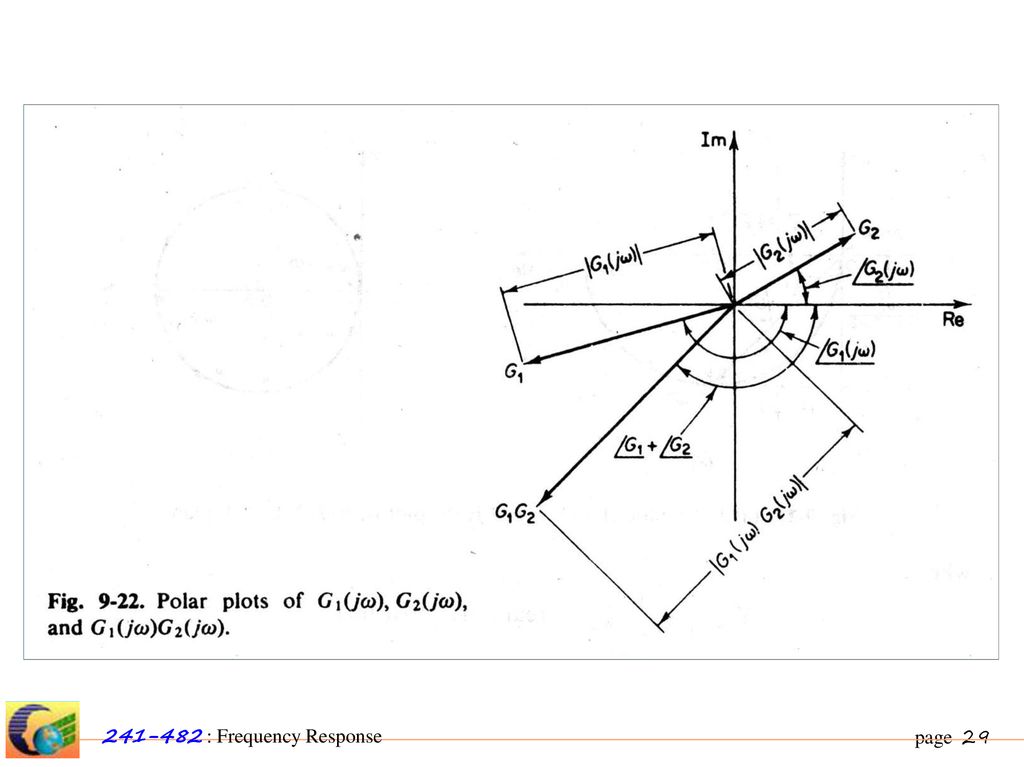
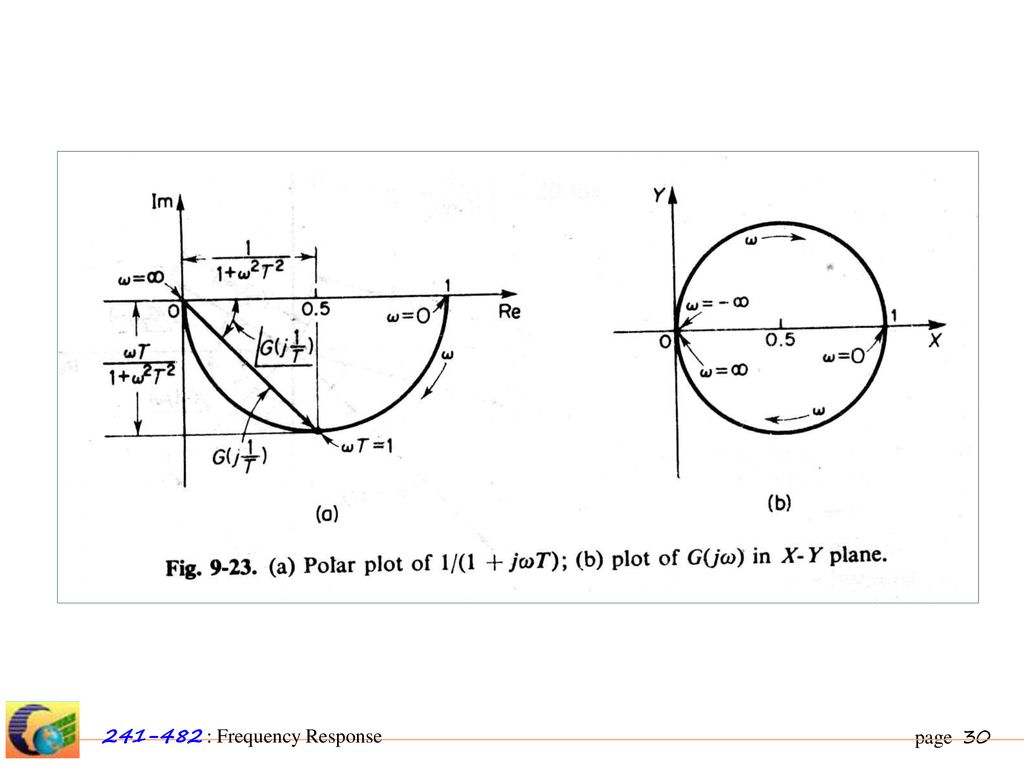
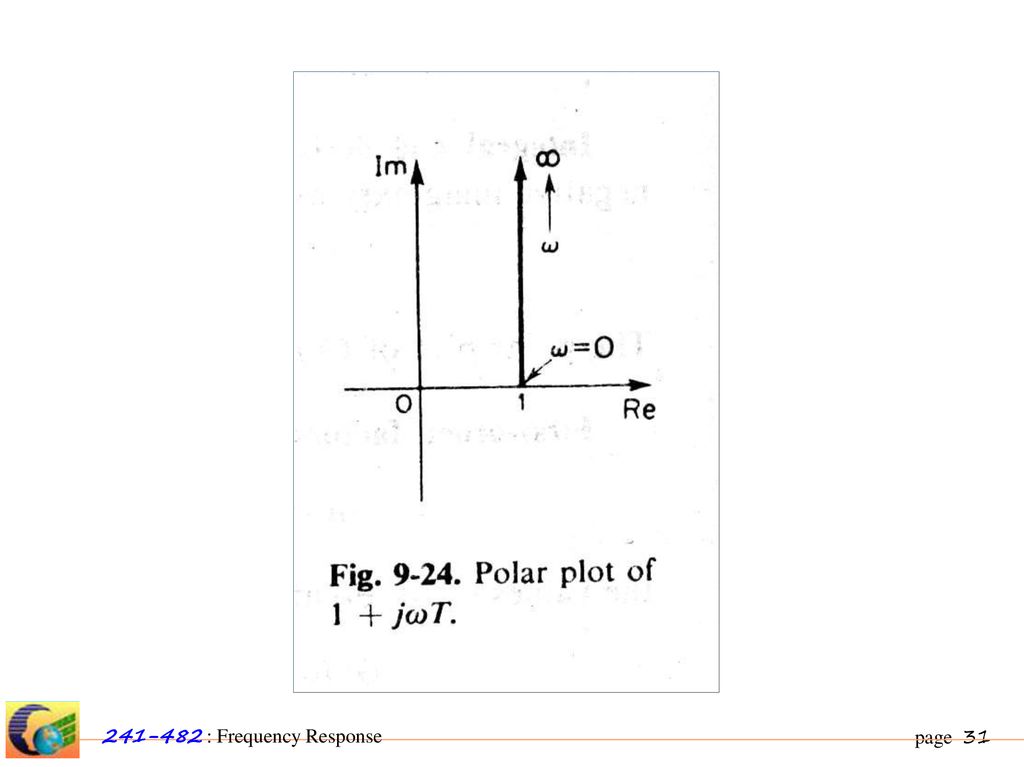
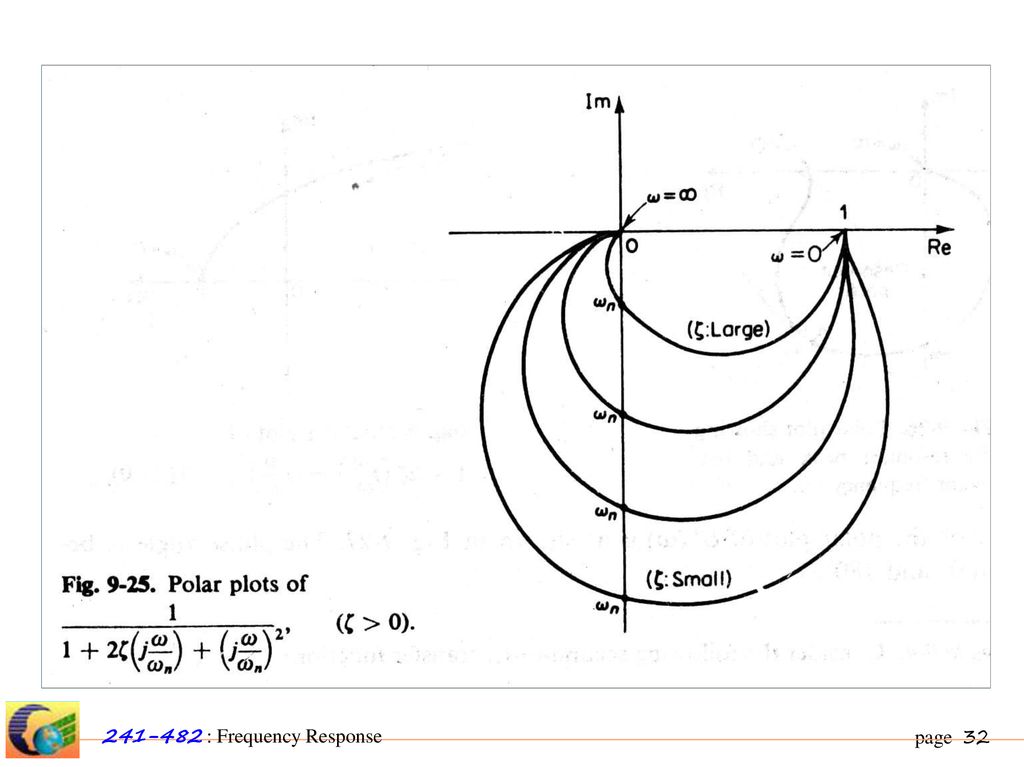
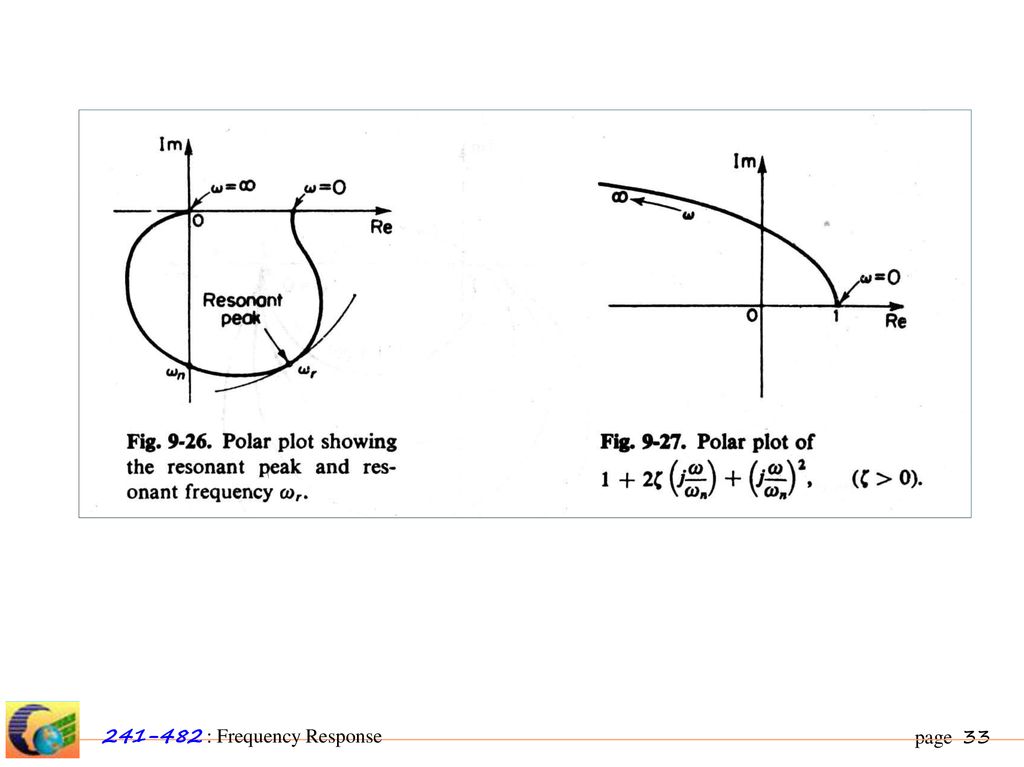
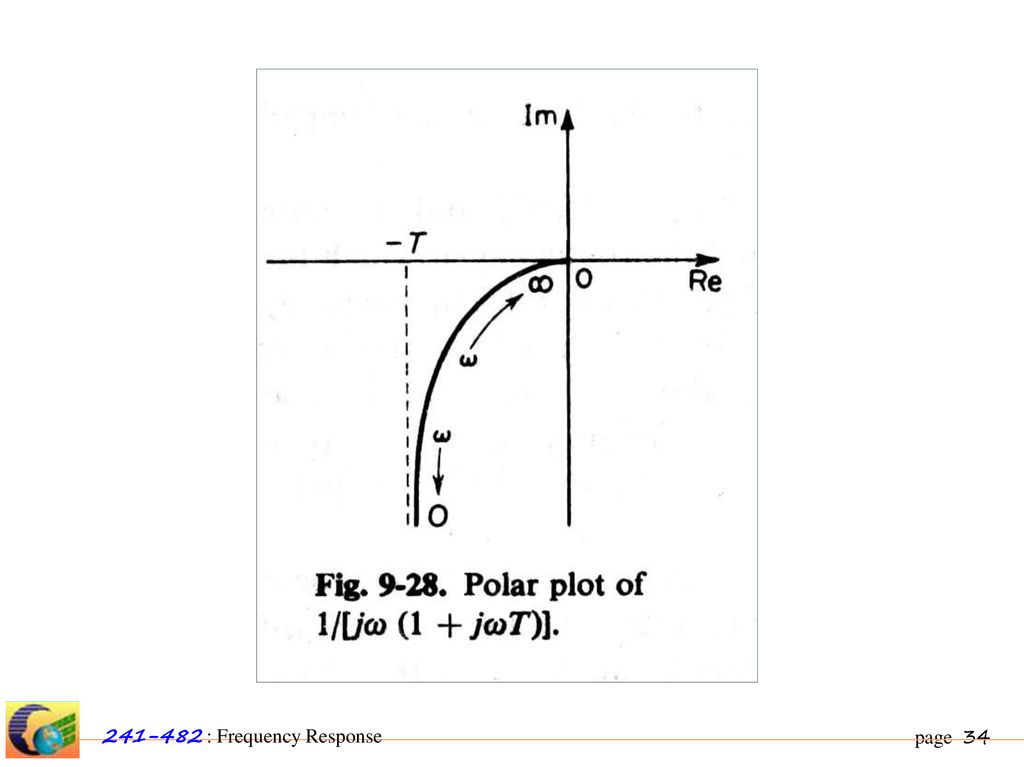
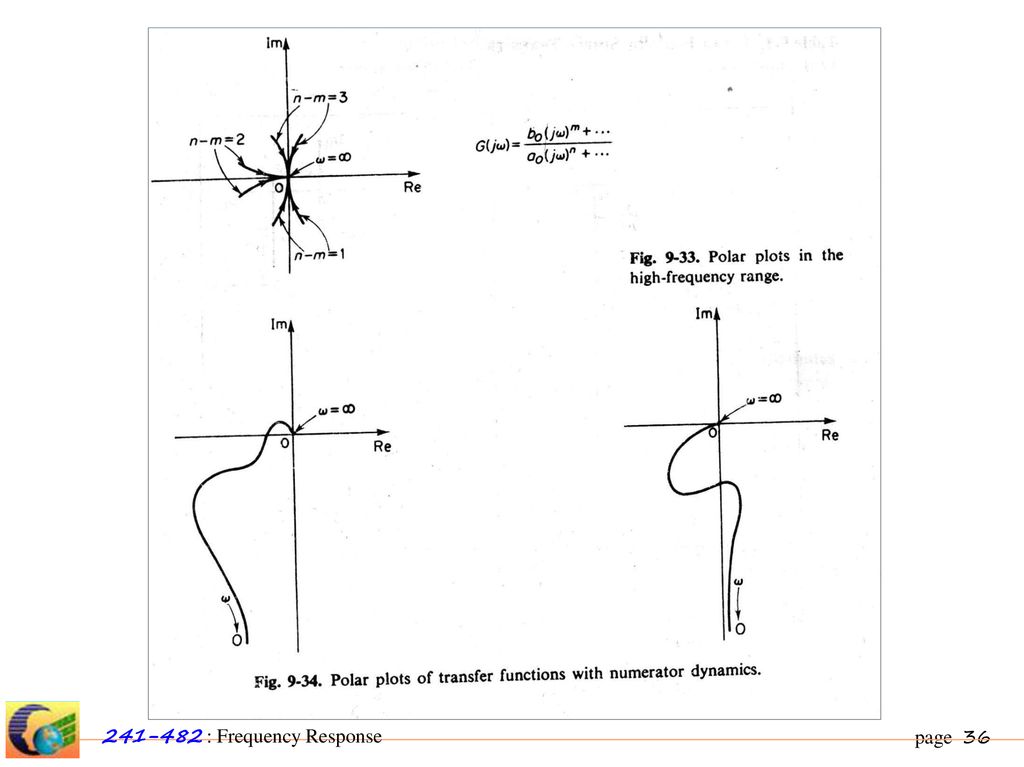
Polar plot

35
𝐺 𝑗ω = 𝐾 𝑧 1 +𝑗ω 𝑗ω 𝑘 𝑝 1 +𝑗ω ...

37
Introduction to the Nyquist Criterion
The NyC relates the stability of a closed-loop system to opened-loop frequency response and open loop pole location Thus knowledge of the opened-loop system's frequency res- ponse yields information about the stability of the closed- loop system.

38
Closed- loop control system

39
Contour enclosing right half-plane to determine stability

40
Nyquist Stability Criterion
If a contour A that encircles the entire right half-plane is mapped through G(s)H(s), then the number of closed-loop poles, Z, in the right half-plane equals the number of open- loop poles, P, that are in the right half plane minus the number of counterclockwise revolutions, N, around -1 of the mapping; that is, Z=P-N. The mapping is called the Nyquist diagram, or Nyquist plot of G(s)H(s).
H(s), then the number of closed-loop. poles, Z, in the right half-plane equals the number of open- loop poles, P, that are in the right half plane minus the number. of counterclockwise revolutions, N, around -1 of the mapping; that is, Z=P-N. The mapping is called the Nyquist diagram, or. Nyquist plot of G(s)H(s).")
41
Mapping examples: a. contour does not enclose closed- loop poles;
b. contour does poles

42
Detouring around open-loop poles:
a. poles on contour; b. detour right; c. detour left

43
Gain Margin and Phase Margin
Nyquist diagram showing gain and phase margins

44
Gain and phase margins on the Bode diagrams

งานนำเสนอที่คล้ายกัน
>")


>")
 Supervisor Dr.GulRooh>")

>")


>")
: สัญญาเช่า (Leases)>")