ดาวน์โหลดงานนำเสนอ
งานนำเสนอกำลังจะดาวน์โหลด โปรดรอ

1
Population and sample Chavanant Sumanasrethakul MD., M.Sc.
Department of Preventive and Social Medicine BMA Medical College and Vajira Hospital 13 Oct 2009

2
จุดมุ่งหมายสำคัญของการศึกษา
นำผลที่ศึกษาไปใช้กับประชากรเป้าหมาย ต้องมีกรอบของประชากรที่ถูกต้อง เพื่อได้ประชากรที่ศึกษาที่เป็นตัวแทนที่ดี ต้องมีขนาดตัวอย่างที่เหมาะสม

3
Statistical Inference
POPULATION SAMPLE INFERENCE I would now like to explain the concept of statistical inference because this is the most important aspect and once grasped I feel that it helps you to have a better understanding of statistical testing. Essentially in medical research we would like to find out if one treatment is more superior that the conventional treatment, Why is their an increase in the incidence of child onset asthma?, Are antibiotics effective in treating otitus media? Interested in laparoscopic surgery of hernia repair in adults. Want to compare it with conventional open hernia repair operation. Essentially to know the real effect of how effective laparoscopic hernai repair is we would collect information from all adults undergoing surgery for hernia repair. Of course this would not be practical. Therefore we need to collect data only from a sample of this population of adults undergoing hernia repair. This sample of patients would then be randomly allocatesd to open or laparoscipic and data pertaining to certain outcomes return to work, compications, hospital stay would be collected for this sample of patients. The efffectiveness of open versus laparoscopic would be estimated using data collected from the sample. We would then want to use the estimates obtained from the sample to make some inference about the true population value of effectiveness. The sample estimate obtatined will rarely equal the true population parameter, but will vary around this true population parameter. This introduces the idea of variability to sample estimates. If wqe took another sample from the population we would be unlikely to find the same estimate of the efeectiveness. Process of making generalisation about a population from a sample.

4
ประชากรและตัวอย่าง ประชากร (population) คือ สมาชิกทั้งหมดที่เราสามารถนำผลการศึกษาไปประยุกต์ใช้ได้ ซึ่งอาจเป็นคน กลุ่มคน องค์กร หรือเหตุการณ์ ประชากรเป้าหมาย (target population) คือประชากรที่เรากำหนดกรอบหรือกฎเกณฑ์ให้เจาะจงขึ้น เพื่อตรงกับความประสงค์ของการศึกษา ซึ่งกรอบนั้นขึ้นกับวัตถุประสงค์ คำถามการวิจัย หรือเกณฑ์ที่มีผู้กำหนดไว้แล้ว
 คือประชากรที่เรากำหนดกรอบหรือกฎเกณฑ์ให้เจาะจงขึ้น เพื่อตรงกับความประสงค์ของการศึกษา ซึ่งกรอบนั้นขึ้นกับวัตถุประสงค์ คำถามการวิจัย หรือเกณฑ์ที่มีผู้กำหนดไว้แล้ว.")
5
ประชากรและตัวอย่าง ประชากรที่ใช้ศึกษา (study population) คือ ประชากรที่ผ่านเกณฑ์การคัดเลือกที่จะนำมาศึกษาโดยเป็นตัวแทนที่ดีสามารถครอบคลุมประชากรเป้าหมายได้เกือบทั้งหมด ซึ่งเกณฑ์ในการพิจารณา (eligibility criteria) มีทั้งการเลือกเข้าและคัดออกโดยพิจารณาจาก 1) เลือกสถานที่ 2) คุณลักษณะของประชากร เช่น เพศ อายุ ระยะของโรค ประชากรที่ติดตามได้ โรคอื่นๆที่เกิดร่วม ความยินยอม
 คือ ประชากรที่ผ่านเกณฑ์การคัดเลือกที่จะนำมาศึกษาโดยเป็นตัวแทนที่ดีสามารถครอบคลุมประชากรเป้าหมายได้เกือบทั้งหมด ซึ่งเกณฑ์ในการพิจารณา (eligibility criteria) มีทั้งการเลือกเข้าและคัดออกโดยพิจารณาจาก. 1) เลือกสถานที่ 2) คุณลักษณะของประชากร เช่น เพศ อายุ ระยะของโรค ประชากรที่ติดตามได้ โรคอื่นๆที่เกิดร่วม ความยินยอม.")
6
Population Research Question Target Population Eligibility Criteria Study Population Sampling Sample Allocation/ Randomization Control Group Experiment Group

7
Measurement (Exposure/Outcome)
Point to consider Target population Study population Sampling frame Sample Sampling unit Study unit Measurement (Exposure/Outcome) Representativeness External validity Sampling bias Response bias Measurement error
 Representativeness. External validity. Sampling bias. Response bias. Measurement error.")
8
Example Imagine that a random sample of 100 individuals is to be selected from a population Their height in cm is measured The mean height is computed Another random sample of 100 individuals from the same population is taken Their height in cm in measured Their mean height is computed This is repeated until 20 random samples have been taken

9
20 samples of size 100 The first sample of heights of 100 people gives a mean of cm and a standard deviation (SD) of 6.03 cm. The second sample gives mean cm & SD 6.74 cm. These figures represent the mean height (cm) for each of the 20 random samples Stress that all samples came from the same population So that the range of weights could have been from 50 to 75kg Look at the spread of the sample means - much tighter between 61.5 and 65.2, so the variability of the sample means is 1.18kg (ie that is the SD of the sampling distribution of the means - not the actual observations the sd of the actual observations is 5.28 kg When talking about the precision of any of these estimates of the mean, then we can say that 1.18 is the level of precision of the mena ie the SE of the mean. How can we use this information.
 for each of the 20 random samples Stress that all samples came from the same population. So that the range of weights could have been from 50 to 75kg. Look at the spread of the sample means - much tighter between 61.5 and 65.2, so the variability of the sample means is 1.18kg (ie that is the SD of the sampling distribution of the means - not the actual observations. the sd of the actual observations is 5.28 kg. When talking about the precision of any of these estimates of the mean, then we can say that 1.18 is the level of precision of the mena ie the SE of the mean. How can we use this information.")
10
Histogram of means of 20 samples

11
Histogram of means of 100 samples

12
Methods of sampling Simple random Systematic Stratified Cluster
Probability Simple random Systematic Stratified Cluster Multi-stage Non-probability Quota Convenience Dimensional Purposive Snowball

13
วิธีการคัดเลือก จุดแข็ง จุดอ่อน Probability Sampling Simple Random
ทุกหน่วยมีโอกาสได้รับการคัดเลือกเท่ากัน นำข้อมูลย้อนกลับไปสู่ประชากรได้ ต้องมี Sampling Frame ที่สมบูรณ์ Systematic เรียงลำดับหน่วย ทำได้ง่าย Stratified แบ่งเป็นกลุ่มแล้วสุ่มจากแต่ละกลุ่ม ได้ตัวแทนจากทุกกลุ่ม Frame แต่ละกลุ่ม Cluster เช่นเลือกคนเดียวในครัวเรือนเป็นตัวอย่าง ไม่ต้องมี Sampling Frame Standard Error สูง Multistage จากจังหวัดเป็น อำเภอ ตำบล

14
Simple random sampling
Each item in the population has an equal chance of being selected for the sample Random number table

15
Systematic sampling Advantages - It is simpler and can be more representative than a simple random sample Disadvantages - possibility of implicit clustering, not a simple random sample

16
Stratified sampling Increases the representativeness of the sample
Increases the precision of the resulting estimates Allows comparison between strata

17
Cluster sampling sample (…) n1 children n2 children Schools
Disadvantages - Less representative than a simple random sample and there is a danger of contamination between respondents Advantages - Cheaper and faster than a simple random sample Schools 1 2 20 (…) n1 children sample n2 children n20 children (clusters) (population)
 n1 children. sample. n2 children. n20 children. (clusters) (population)")
18
Multi-stage sampling H
Different sampling units are sampled at different stages Example Geographical areas of Thailand would randomly be selected, from which hospitals would be randomly selected from which wards/patients would then be randomly selected. H areas (patients)
")
19
Non-probability sampling
การเอกตัวอย่างแบบกำหนดจำนวนไว้ก่อน (quota sampling) การเลือกตัวอย่างแบบสะดวก (convenience sampling) การเลือกตัวอย่างตามมิติ (dimensional sampling) การเลือกตัวอย่างแบบมีจุดมุ่งหมาย (purposive sampling) การเลือกตัวอย่างแบบลูกโซ่ (snowball sampling)
 การเลือกตัวอย่างแบบสะดวก (convenience sampling) การเลือกตัวอย่างตามมิติ (dimensional sampling) การเลือกตัวอย่างแบบมีจุดมุ่งหมาย (purposive sampling) การเลือกตัวอย่างแบบลูกโซ่ (snowball sampling)")
20
Probability sampling Advantages (easy to analyse) should be unbiased
known precision Disadvantages requires sampling frame to be known expense

21
Non-probability sampling
Advantages cheap Quick Disadvantages may be biased no estimate of precision

22
Sample size

23
Sample size Why is it so important? How do you calculate it?
What information do you need? Only going to look at sample size for a comparative study. Also possible to for surveys etc.

24
Sample size (i) Sample size important because :
too small a sample will fail to detect clinically important effects too large a sample will identify statistically significant differences which have no clinical relevance both situations unethical Use Craig’s tossing a coin and counting heads example to kick off with. No point in running a trial that which will not be able to answer questions asked of it. 200 patients in a trail where 100 would have done results in 50 getting inferior treatment. All unethical if scientifically useless, waste of resources and unethical use of subjects.

25
Factors which determine sample size calculation
The study design (Survey), comparative, repeated measures The outcome measure categorical, continuous The statistical analysis t-test, chi-squared, regression .
, comparative, repeated measures. The outcome measure. categorical, continuous. The statistical analysis. t-test, chi-squared, regression. .")
26
Comparative studies Null hypothesis: Treatment A = Treatment B
Alternative hypothesis Treatment A Treatment B

27
Significance level and power
Significance Level (Type I error rate) This is the probability that the statistical test returns a significant result when there is no difference between treatments Power (Type II error rate) This gives the probability that a study of a given size would detect, as statistically significant, a real difference of a given magnitude Significance level, known as type I error rate. Explain a p-value. Power Type II error rate. Explain power. (remember to to include should it exist, and as large or more extreme!) Large differences are easy to detect, explain why.
 This is the probability that the statistical test returns a significant result when there is no difference between treatments. Power (Type II error rate) This gives the probability that a study of a given size would detect, as statistically significant, a real difference of a given magnitude. Significance level, known as type I error rate. Explain a p-value. Power Type II error rate. Explain power. (remember to to include should it exist, and as large or more extreme!) Large differences are easy to detect, explain why.")
28
Factors which affect sample size
The proportion with/average of the feature of interest in the control group Minimum clinically significant difference The smallest difference in effectiveness between two treatments that would be deemed to be clinically relevant Significance level Power Measure of variability

29
Example of categorical data
How many children with acute otitus media are needed in a clinical trial to test whether antibiotic treatment changes the proportion of children with normal eardrums Statistical Test for this sort of data? The null hypothesis in this example? What information do we need to calculate the sample size?

30
That’s the way to do it! The proportion with the feature of interest in the control group i.e. An estimate proportion with normal ear drums when not treated, 75% The increase/decrease in the proportion of interest judged to clinically significant In this case, 10% Power and significance levels 80% power and 5% significance

31
Continuous outcome How many patients are needed in a trial to evaluate the effect of supplementary vitamin D given to pregnant women in preventing neonatal hypocalcaemia? (Want to increase the mean serum calcium level!) Statistical Test? Null hypothesis?
 Statistical Test Null hypothesis")
32
Continuous (continued)
Difference in mean serum calcium level that would be considered a clinical improvement Increase of 0.5mg per 100ml Estimate of the variation between infants in their serum calcium level sd = 1.8 mg per 100ml (where do we get this info?) Power and significance level 80% and 5 % Calculate standardised difference standardised difference = difference/sd
 Power and significance level. 80% and 5 % Calculate standardised difference. standardised difference = difference/sd.")
33
Limitations Sample size calculation is not an exact science, could be considered informed guess work Need for general consensus on what constitutes clinically important Reporting of a sample size calculation does not infer that the study is adequately powered, study may not have recruited as many people as they anticipated, or suffered dropouts or loss to follow-up

34
The truth is out there An accurate inference is required to be both precise and unbiased Steps should be taken to ensure that this is so Minimise bias by (adequate) randomisation concealment and blinding checking that missing data does not follow patterns Maximise precision formal statistical power calculation CONSORT statement! (see references)
 randomisation. concealment and blinding. checking that missing data does not follow patterns. Maximise precision. formal statistical power calculation. CONSORT statement! (see references)")
35
Quantitative Method (การวัดเชิงปริมาณ) Qualitative Method
(การวัดเชิงคุณภาพ) Research question Estimation ทำในกลุ่มเดียว Incidence Prevalence Association ทำในกลุ่มเดียวหรือสองกลุ่ม การสูบบุหรี่และมะเร็งปอด Difference ทำในสองกลุ่ม ยา A ดีกว่ายา B หรือไม่
 Research question. Estimation. ทำในกลุ่มเดียว. Incidence. Prevalence. Association. ทำในกลุ่มเดียวหรือสองกลุ่ม. การสูบบุหรี่และมะเร็งปอด. Difference. ทำในสองกลุ่ม. ยา A ดีกว่ายา B หรือไม่")
36
Alpha and beta errors Truth การทดสอบทางสถิติ (Fact) A=B A = B
ยอมรับ Ho : A = B error (type II) ปฏิเสธ Ho, ยอมรับ H1 αerror (type I)
 ปฏิเสธ Ho, ยอมรับ H1. αerror. (type I)")
37
Estimation single group

38
Proportion response variable
The one-sample problem Estimating the population proportion (P) Where d = Precision or difference (| p - P|) Z = at 95% CI 1.64 at 90% CI P = the proportion in population or the true proportion n = Z2 P (1 - P) d2
 Where d = Precision or difference (| p - P|) Z = 1.96 at 95% CI at 90% CI. P = the proportion in population. or the true proportion. n = Z2 P (1 - P) d2.")
39
ตัวอย่าง ต้องการประมาณสัดส่วนของความดันโลหิตสูงในผู้สูงอายุ
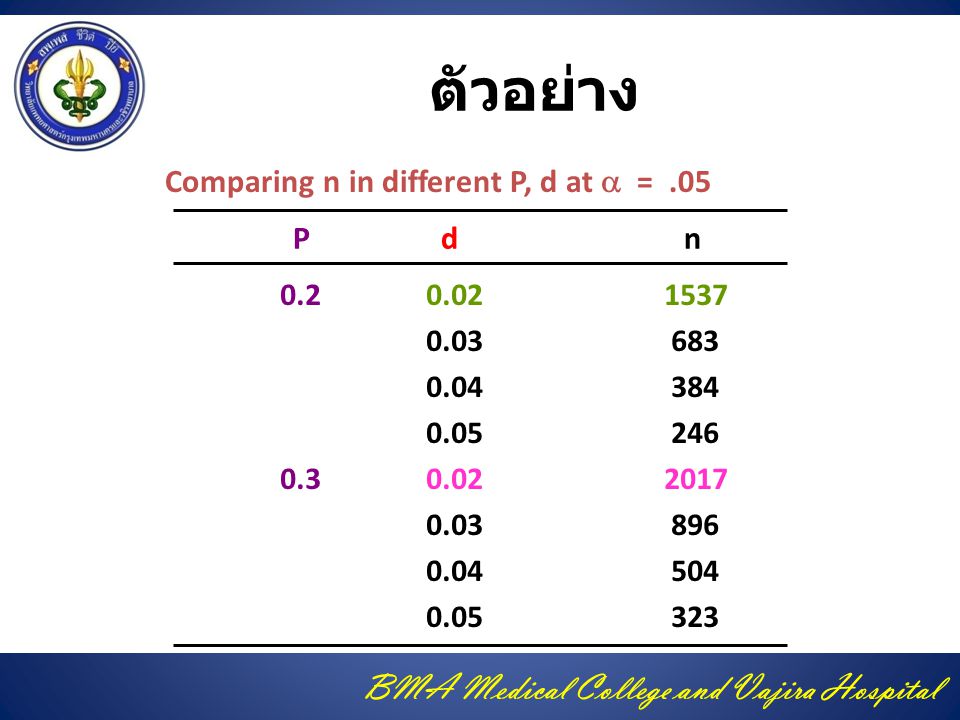
การศึกษาความชุกในอดีตเท่ากับร้อยละ 20 และความคลาดเคลื่อนที่ยอมรับได้เท่ากับร้อยละ 5 P = 0.2 1- P = 0.8 Za at 5% = d = or 5% ( Absolute diff.) n = 246
 n = 246.")
40
ตัวอย่าง Comparing n in different P, d at a = .05 P d n 0.2 0.02 1537
41
Continuous response variables
The one-sample problem Estimating the population mean n = Za2 2 d2 2 = variance of data d = precision or | X - m|

42
Difference two independent groups

43
Note : this formula is derived for equal sized group
Hypothesis testing Ho : P1 - P2 = 0 Ha : P1 - P2 = 0 n|group = {Za 2Pc(1-Pc) + Zb Pt(1-Pt) + Pc(1-Pc) }2 (Pt - Pc)2 where Pt = treatment, Pc = control Za at two-tailed (1.96)or one-tailed test (1.64) Z at one-tailed test Power = 1 – Note : this formula is derived for equal sized group
 + Zb Pt(1-Pt) + Pc(1-Pc) }2. (Pt - Pc)2. where Pt = treatment, Pc = control. Za at two-tailed (1.96)or one-tailed test (1.64) Z at one-tailed test. Power = 1 – Note : this formula is derived for equal sized group.")
44
Hypothesis testing for two population means
Ho = m1 - m2 = 0 Ha = m1 - m2 = 0 n|group = 2 s2 [ Za+Zb ]2 [m1 - m2]2

45
Difference two related groups

46
Sample size for dependent samples
2 n pair = (Za + Zb) s s = variance of the within pair diff. = the value of the mean diff. that is clinically important to detect
 s. s = variance of the within pair diff. = the value of the mean diff. that is clinically important. to detect.")
47
Association

48
Unmatched Case-Control Studies
Schlesselman (1982) 2 n|group = Z 2Po(1-Po) + Z P1(1-P1)+P2(1-P2) P1 - P2 P1 = P2 (OR) 1+P2 (OR-1) P2 = the proportion exposed in control OR = odds Ratio Po = (P1+P2) /2 where
 2. n|group = Z 2Po(1-Po) + Z P1(1-P1)+P2(1-P2) P1 - P2. P1 = P2 (OR) 1+P2 (OR-1) P2 = the proportion exposed in control. OR = odds Ratio. Po = (P1+P2) /2. where.")
49
matched Case-Control Studies
2 N pair = Z 2 Z P1P2/ P1 - P2 P1 = ma/N P2 = mb/N = (P1 + P2) / 2 where Control + - Case m a m b
 / 2. where. Control. + - Case. m a. m b. ")
50
Cohort Studies 2 n|group = Z 2P(1-P) + Z P1(1+R-P1(1+R2)) P1(1-R)
P1 = Incidence of non exposure R = Relative risk P = (P1(1+R)) / 2 where
) / 2. where.")
51
การกระจายตัวอย่างเป็นกลุ่มควบคุมกลุ่มทดลอง
การจัดสรรแบบสุ่ม (Randomization) เช่น โยนเหรียญ การจับสลาก การจัดสรรแบบบล็อก (Block Randomization) เช่น กลุ่มควบคุม=C กลุ่มทดลอง=E จัดเรียงเป็น CCEE, CECE, CEEC, EECC, ECEC, ECCE จัดแบบแบ่งชั้น (Stratified allocation) เช่นโรคมะเร็งลำไส้ใหญ่ แบ่งเป็น Duke’s A,B,C ก่อนแล้วจัดสรรแบบสุ่มต่อไป จัดแบบ Minimization โดยโปรแกรมคอมพิวเตอร์
 เช่น โยนเหรียญ การจับสลาก. การจัดสรรแบบบล็อก (Block Randomization) เช่น กลุ่มควบคุม=C กลุ่มทดลอง=E จัดเรียงเป็น CCEE, CECE, CEEC, EECC, ECEC, ECCE. จัดแบบแบ่งชั้น (Stratified allocation) เช่นโรคมะเร็งลำไส้ใหญ่ แบ่งเป็น Duke’s A,B,C ก่อนแล้วจัดสรรแบบสุ่มต่อไป. จัดแบบ Minimization โดยโปรแกรมคอมพิวเตอร์")
52
Simple randomization การจัดสรรแบบสุ่ม เช่น โยนเหรียญ การจับสลาก

53
Block Randomization การจัดสรรแบบบล็อก
เช่น กลุ่มควบคุม=C กลุ่มทดลอง=E จัดเรียงเป็น CCEE CECE CEEC EECC ECEC ECCE

54
Stratified allocation
จัดแบบแบ่งชั้น เช่นโรคมะเร็งลำไส้ใหญ่ แบ่งเป็น Duke’s A,B,C ก่อนแล้วจัดสรรแบบสุ่มต่อไป

55
Minimization โดยใช้โปรแกรมคอมพิวเตอร์

56
Solution In a survey, a RANDOM SAMPLE should allow for findings to generalised from survey sample to population and minimise selection bias In a comparative study, RANDOMISATION should ensure equal prognostic characteristics in each group, allowing any difference in effect to be attributed to the intervention

งานนำเสนอที่คล้ายกัน
 ในช่วงยุค Internet เพิ่ง เริ่มต้น เป็นบริษัทที่ดำเนินงานทางด้าน.>")


 3 วิธี 1. Distribution.>")


 to one another and different from (or.>")
