ดาวน์โหลดงานนำเสนอ
1
2. แสดงรายการเกี่ยวกับการบิน (Aeronautical Symbols)
Aerodrome Information Characteristics Traffic Control Boundaries Instrument Landing Aids Radio Facilities : Beacons, Control Tower Frequencies, VOR, ILS Aeronautical Lights White – Green :Civil Airfield 2 White – Green : Mil Airfield White – Yellow : Water airfield White – red : significant land mark Miscellaneous : Caution, Danger area, Isogonics Lines

2
Scale Scale = Chart Length / Earth Length
Small Scale : Large Area Less Detail 1:600,000 or smaller Middle Scale Bigger than 1:600,000 but smaller than 1:75,000 Large Scale : Small Area More Detail 1:75,000 and bigger Distance : measure between parallel of latitude by measuring meridian 1 minute = 1 NM.

3
Plotting and Measuring
Basic operations in Dead Reckoning. Plotting is the location of points or courses on chart by their coordinates of latitude and longitude. Measuring is the determination of distance and direction between points on a chart. Tools: pencil, eraser, dividers, and plotter

4
Plotter A device for drawing and measuring courses and distances
Weems Aircraft Plotter Mark II, MK IIN The principal use of a plotter is the measurement of true course, which is line on a chart representing the path over which the aircraft to travel. Its direction is determined by the angle it make with the meridians, which run north and south

5
Plotter Straight edge aligned with True Course (TC)
Center hole over meridian or parallel Scale indicated by arrow Read direction on scale over meridian or parallel A course between 0º and 180º is measured along the outer scale; A course between 180º and 360º is measured along the inner scale It is wise to estimate the direction roughly prior to exact measurement as “a commonsense check”

7
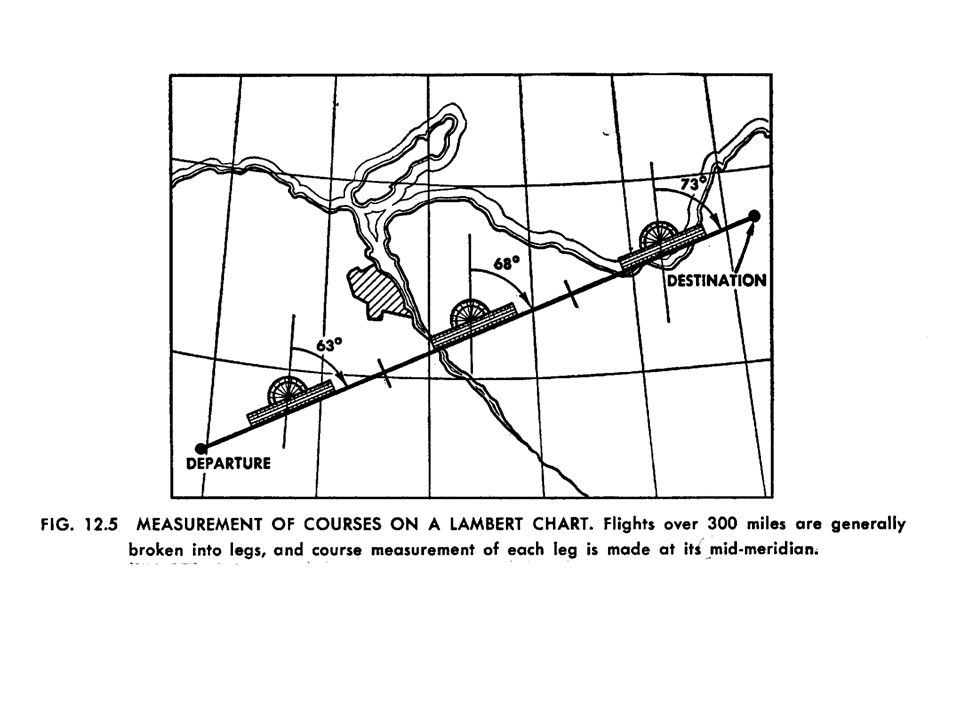
Plotting and Measuring on a Lambert Chart
The graticule of a Lambert chart, is characterized by converging meridians. The error will be at a maximum for east-west courses and at a minimum for north – south courses For distance of miles, it is advantageous to make one course measurement for entire route at mid-longitude; For longer runs it is wiser to break the course into segments, changing to new course with each new segment encountered

9
Plotting and Measuring on a Lambert Chart
On Lambert charts the plotters may be convenient than dividers as a means of measuring distance. Since the Lambert charts was seen to be uniformity of scale over rather large areas Hence, dividers spanned to 100 miles on one Lambert would measure 100 miles on any part of any Lambert of the same scale

10
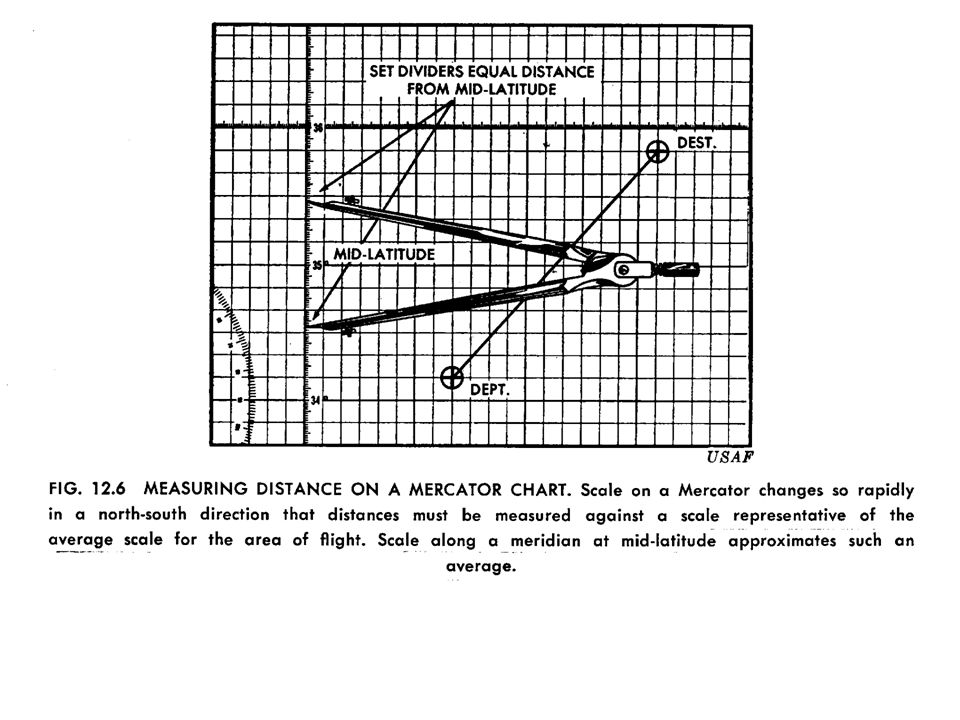
Plotting and Measuring on a Mercator Chart
On a Mercator, meridians are parallel lines. Any straight line cutting them will be a transversal, cutting across each at the same angle. Direction from true north may be measured accurately at any meridian and not only at mid-longitude as on a Lambert. Scale of distance on a Mercator is constantly changing. The scale along any Mercator course is relatively contracted on the portion nearest the equator, and expanded toward the pole. The true Mercator distance of the entire course can be measured only against a scale chosen along a portion of course where an average scale exists.

12
Chapter 4 Pilotage and DR

13
Words for Air Navigation
Track (TR) is the actual horizontal direction made by the aircraft over the earth (due to wind) or actual path Course (C) is the intend horizontal direction or travel. There are TC, MC, CC (Compass Course) = Track Made Good True Course (TC) : The intended or actual path over the ground measured from true north Heading (HDG) is the horizontal direction in which the A/C is pointed. There are TH, MH, CH True Heading (TH): the direction from true north in which the aircraft is pointed Ground Speed (GS) Speed in relation to a fixed point on the earth. Knots, MPH, km/hr True Airspeed (TAS) Speed of an aircraft through a mass of air
 is the actual horizontal direction made by the aircraft over the earth (due to wind) or actual path. Course (C) is the intend horizontal direction or travel. There are TC, MC, CC (Compass Course) = Track Made Good. True Course (TC) : The intended or actual path over the ground measured from true north. Heading (HDG) is the horizontal direction in which the A/C is pointed. There are TH, MH, CH. True Heading (TH): the direction from true north in which the aircraft is pointed. Ground Speed (GS) Speed in relation to a fixed point on the earth. Knots, MPH, km/hr. True Airspeed (TAS) Speed of an aircraft through a mass of air.")
14
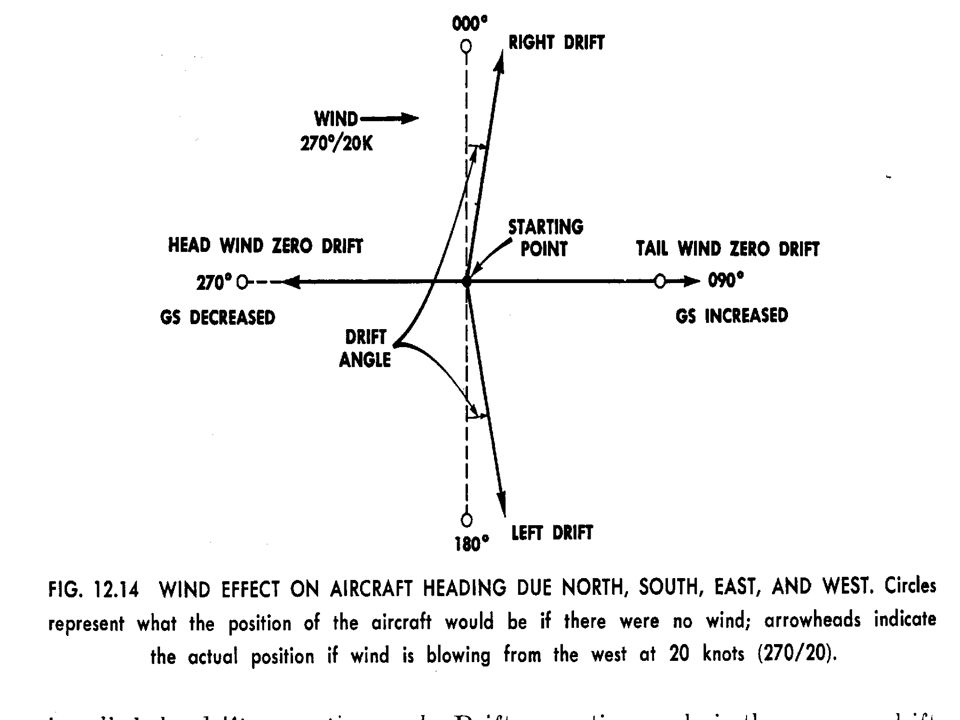
Wind and Wind Effect Wind has direct and speed Wind direction “from”
The lateral displacement effected by wind is “drift”, The angle between intended and actual track is “drift angle” The number of degrees that an aircraft is turn into wind in order to fly a desired path over the ground is called “ the drift-correction angle” The drift-correction angle is the same as drift angle but opposite direction In making a drift correction, the pilot has not prevented drift but corrected for it.

16
Vectors and the Wind Triangle
In Dead Reckoning there are six basic measures with concerned: True Air Speed (TAS): Speed of an aircraft through a mass of air True Heading (TH): The direction from true north in which the aircraft is pointed &4. Wind Direction / Velocity (W/V) 5. Ground Speed (GS) Speed in relation to a fixed point on the earth. 6. True Course (TC) : The intended or actual path over the ground measured from true north
: Speed of an aircraft through a mass of air. True Heading (TH): The direction from true north in which the aircraft is pointed. &4. Wind Direction / Velocity (W/V) 5. Ground Speed (GS) Speed in relation to a fixed point on the earth. 6. True Course (TC) : The intended or actual path over the ground measured from true north.")
17
The six measures listed always pair together as the following vectors:
Wind Direction – Wind Speed True Heading – True Air Speed True Course – Ground Speed

18
Wind Determination Forecast Winds:
Winds are measured and predicted by weather experts (Balloons and analysis of pressure system) Winds at flying altitudes for use in planning a flight Winds change with altitude and with the nature of the terrain over which they pass Direct Observation: at altitude of a few throusand feet , wind direction can sometimes be checked by watching smoke plumes; over water, by the washback of foam from whitecaps. The number of whitecaps is also an indication of wind speed. Winds change in both speed and direction with altitude The passage of cloud shadows across the ground is usable at times as a check on wind direction In fast, high flying aircraft none of these devices is value
 Winds at flying altitudes for use in planning a flight. Winds change with altitude and with the nature of the terrain over which they pass. Direct Observation: at altitude of a few throusand feet , wind direction can sometimes be checked by watching smoke plumes; over water, by the washback of foam from whitecaps. The number of whitecaps is also an indication of wind speed. Winds change in both speed and direction with altitude. The passage of cloud shadows across the ground is usable at times as a check on wind direction. In fast, high flying aircraft none of these devices is value.")
19
Wind Determination Winds Between Two Positions : it is average wind between two position The average True Heading (TH) and True Airspeed (TAS) derived from the aircraft’s instruments, The Ground Speed (GS) and Drift Angle, are entered on the wind face of the computer and unknown wind vector is solved Drift Angle is the difference between Track (TR) and TH ; if TH is greater, drift is left, if TR is greater, drift is right
 and True Airspeed (TAS) derived from the aircraft’s instruments, The Ground Speed (GS) and Drift Angle, are entered on the wind face of the computer and unknown wind vector is solved. Drift Angle is the difference between Track (TR) and TH ; if TH is greater, drift is left, if TR is greater, drift is right.")
20
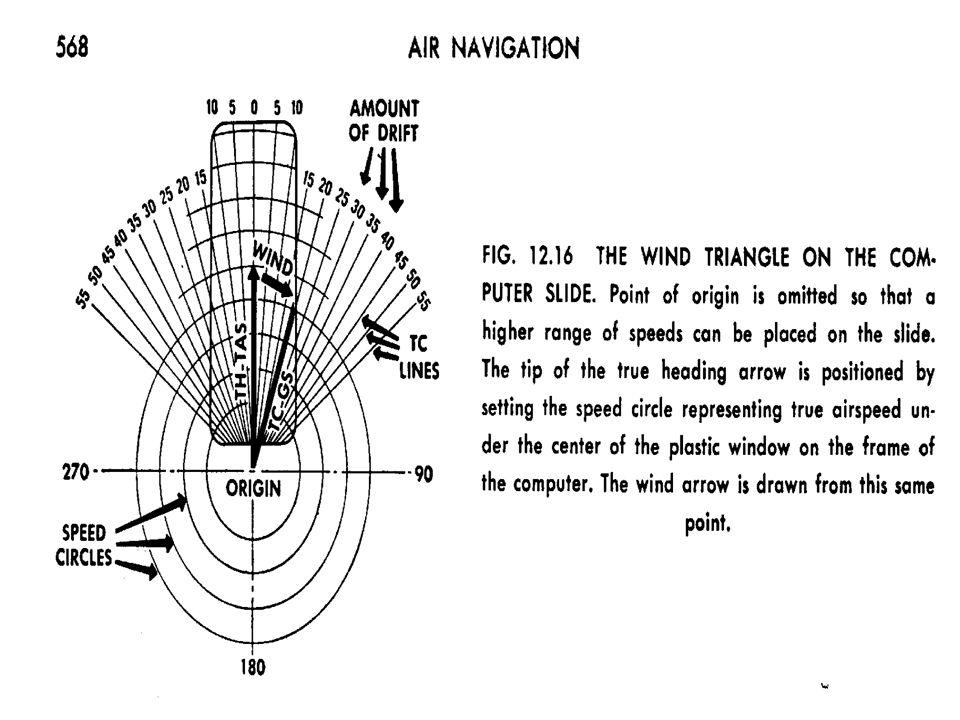
Wind Triangle Air Vector (Air Plot) Wind Vector (W/V)
TH : direction of the vector TAS: magnitude of the vector Wind Vector (W/V) Wind Direction Speed The tail of wind vector always connected to the head of the air vector. Cross Vector or Ground Vector GS: Ground Speed TR: Track
 Wind Direction. Speed. The tail of wind vector always connected to the head of the air vector. Cross Vector or Ground Vector. GS: Ground Speed. TR: Track.")
21
Air Vector Track-Ground Speed

22
Drift Angle is the difference between Track (TR) and TH ; if TH is greater, drift is left, if TR is greater, drift is right TH 360º TH 360º TR 005º TR 350º Drift Angle 5ºL Drift Angle 5ºR TR is greater, drift is right TH is greater, drift is left

23
TN TH:045º Wind from 330 TR / GS

24
Any distance between the ground position and air position must represent wind effect
An arrow drawn from air position to ground position will be a wind vector

25
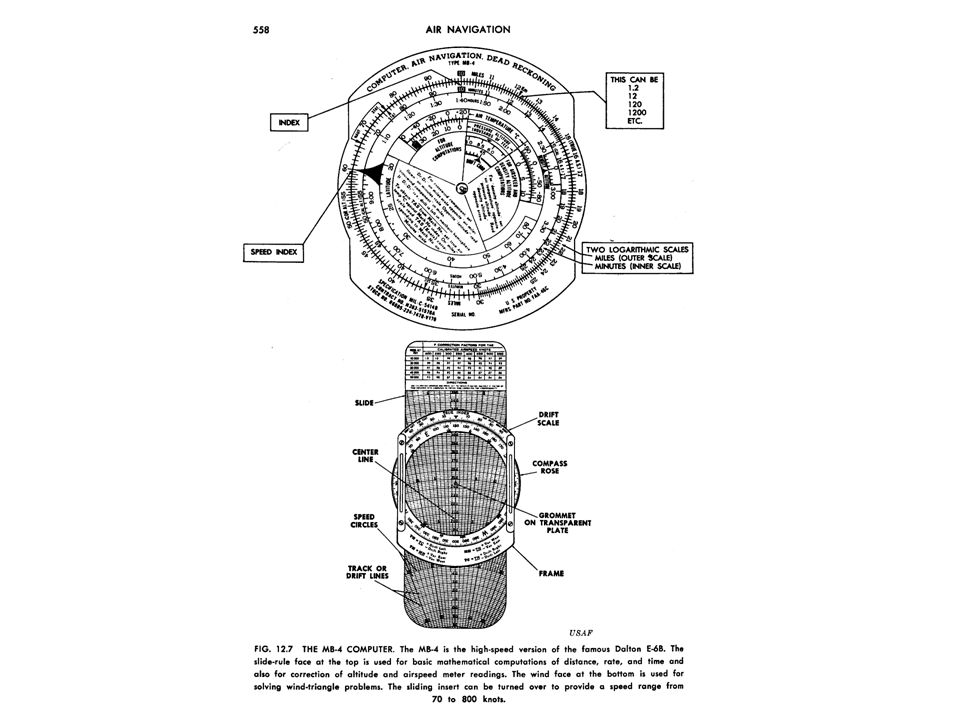
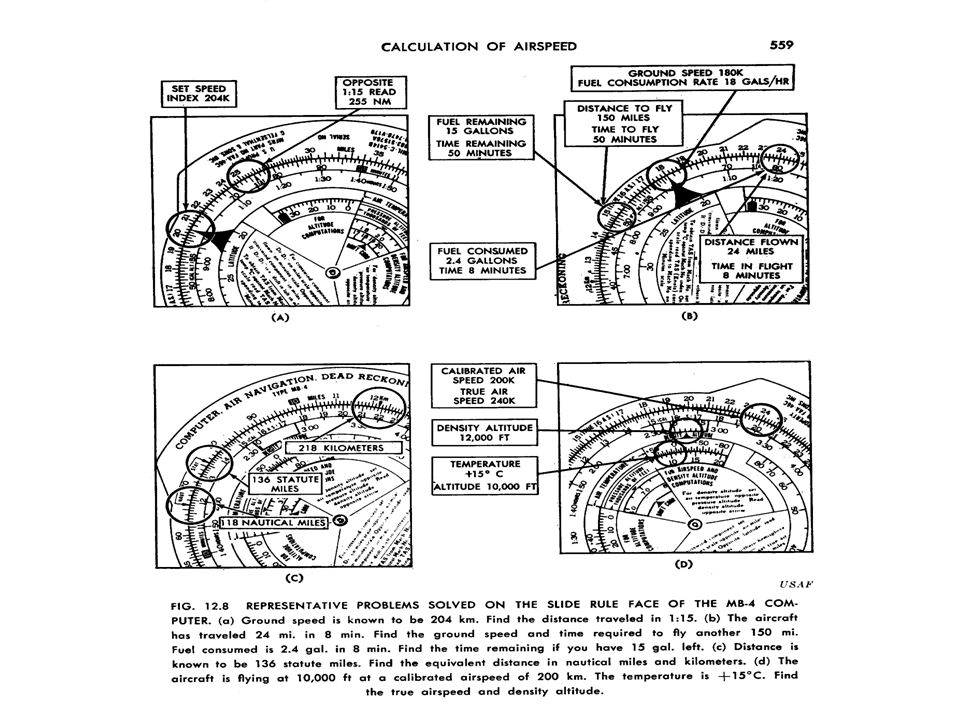
Dead Reckoning Computer
Dalton E-6B/MB-4

30
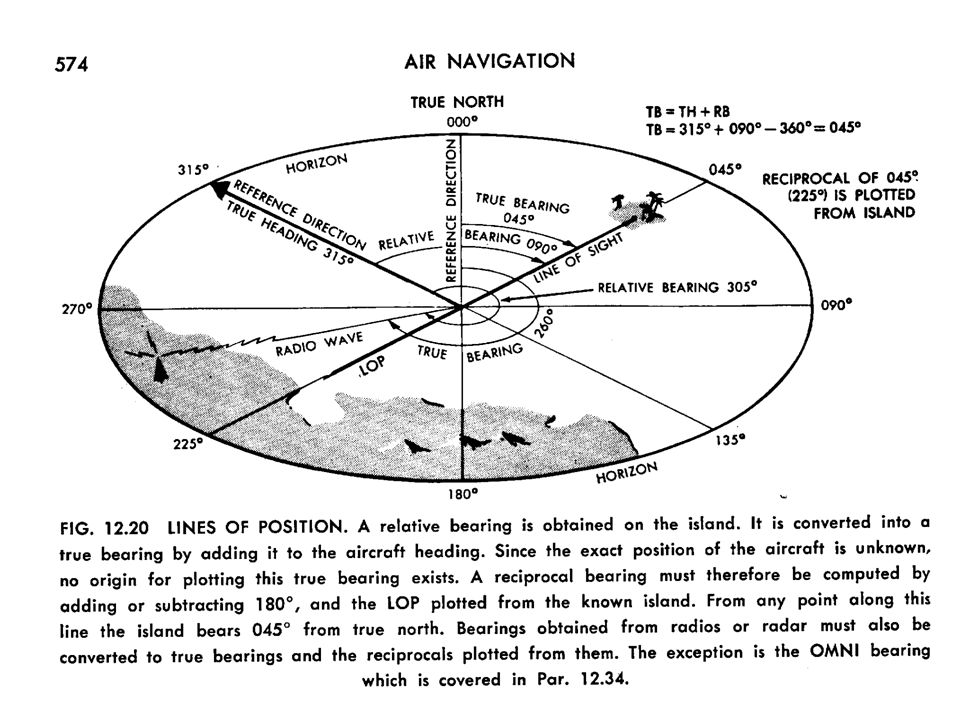
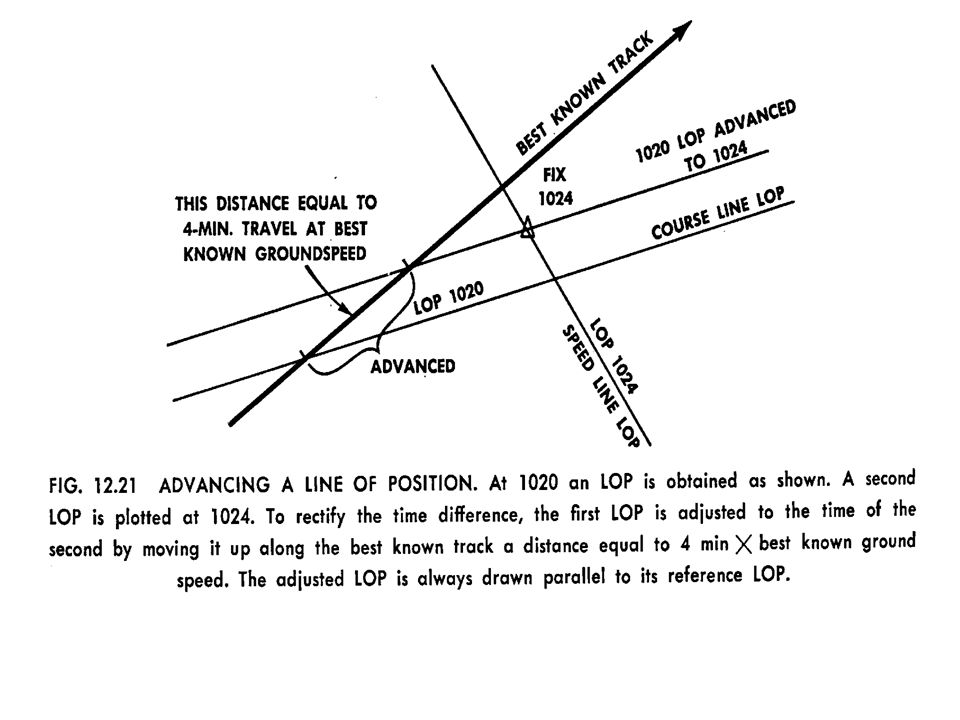
Line Of Position (LOP) LOP is a line connecting all possible geographic positions of an aircraft at a given instant The line can be straight or curved, depending on the source of information: A true bearing from a mountain peak will be a Straight line Of Position; Distance from an object will be a circle of radius equal to the distance Lines of position determined by loran are hyperbolas

32
Fix A fix is an established geographic position of an aircraft for a given instant time. It is a point, not a line. A fix can be found only by crossing two or more LOP’s independently determined Any two LOP’s intersecting at an angle greater than 30º will normally provide reliable fixing, the best results are obtained when they cross at right angles

34
Altitude Indicated Altitude: is read directly from altimeter when it is directly adjusted to the local altimeter setting Pressure Altitude: is displayed on altimeter when it is set to the standard sea level atmospheric pressure of in.Hg At or above transition altitude Called Flight Level Density Altitude: is pressure altitude corrected for nonstandard temperature used to determine aircraft performance True Altitude: is the actual height of an object above mean sea level True altitude and Pressure Altitude are equal only when standard atmospheric condition exist Absolute Altitude: is the actual height of the airplane above the earth’s surface Height above ground level (AGL) Height Above Airport (HAA) Height Above Touch Down Zone (HAT) Threshold Crossing Height (TCH)
 Height Above Airport (HAA) Height Above Touch Down Zone (HAT) Threshold Crossing Height (TCH)")
35
Altitude 1 inch Hg = 1,000 ft 1 mb = 30 ft
When flying from high to low (Press), or hot to cold , look out below.
, or hot to cold , look out below.")
36
Navigation Technique

37
สิ่งที่ต้องทำความเข้าใจก่อนทำการบิน
การบินอย่างถูกต้อง การวางแผน สมรรถนะของเครื่องบิน การคำนวณ การวิเคราะห์ และอ่านแผนที่ การใช้วิทยุ และเครื่องช่วยเดินอากาศ

38
การบินอย่างถูกต้อง Heading +/- 2° Speed +/- 5 % ของ TAS
Altitude +/- 200 feet

39
การวางแผนก่อนการบิน การเตรียมแผนที่ รายละเอียดของเส้นทางบิน ข่าวอากาศ
การคำนวณหาค่าต่างๆ ตาม Flight plan การคำนวณน้ำมัน กฎการบินต่างๆ การเขียน Flight log

40
การเตรียมแผนที่ ถ้าบินเดินทางต่ำ ควรใช้แผนที่มาตราส่วนใหญ่
ถ้าบินเดินทางสูง ควรใช้แผนที่มาตราส่วนเล็ก มาตราส่วนเล็ก เช่น 1: 600,000 จะคลุมพื้นที่ได้มากแต่มีรายละเอียดน้อย มาตราส่วนใหญ่ เช่น 1: 75,000 จะคลุมพื้นที่ได้น้อยแต่มีรายละเอียดปลีกย่อยมาก ดังนั้นแผนที่ที่มีขนาดเท่ากัน แผนที่มาตราส่วนเล็กจะคลุมพื้นที่ได้มาก ส่วนแผนที่มาตราส่วนใหญ่จะคลุมพื้นที่ได้น้อย 1: 1,000,000 1 : 250,000

41
ลาก Track และจุด Reporting Points

42
2. วัดระยะทาง ทิศทางของ Track ที่จะบินไป และ หา Variation ตามเส้นทางที่ผ่าน
มุมที่ต่างกันระหว่าง True North กับ Magnetic North

43
3. หาพื้นที่ Prohibited, Restricted และ Danger Areas ที่มีผลต่อเส้นทางบิน

44
4.คำนวณหา Safety Height ในเส้นทางบินกรณีที่ต้องลดระยะสูง เมื่อบินในลักษณะอากาศที่เป็น IMC
It is suggested that you cross mountain passes at an altitude at least 1,000 feet above the pass elevation. The cloud clearance requirement is at least 1,000 feet below the clouds. You should make sure that you have at least a 2,000 foot ceiling over the highest pass you will cross

45
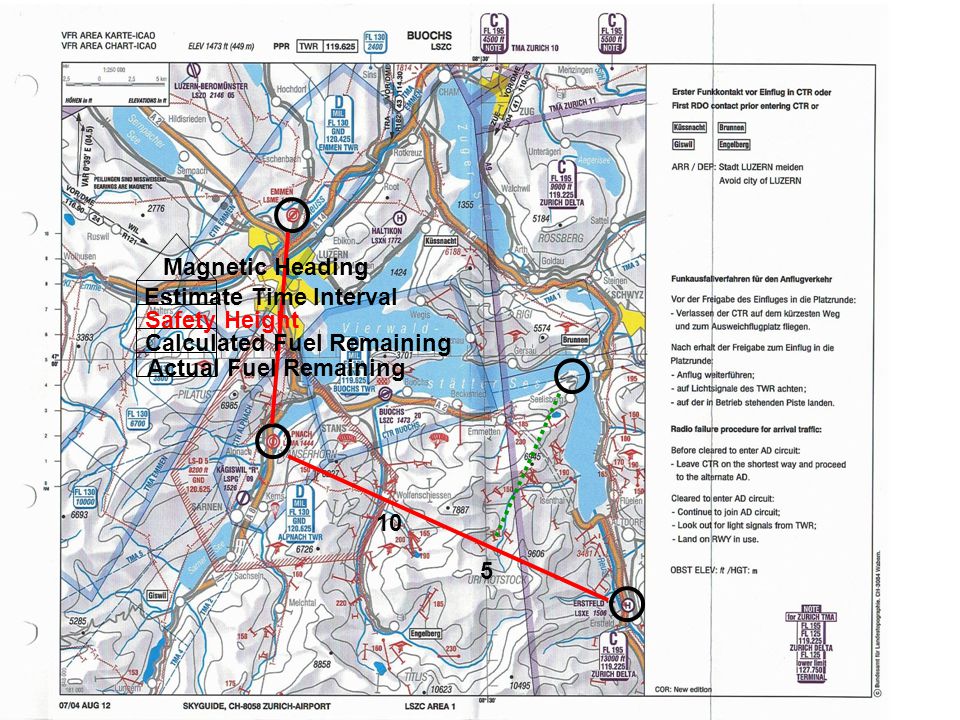
Calculated Fuel Remaining
สัญลักษณ์บนแผนที่ TURNING POINT INFORMATION BLOCK 350 Magnetic Heading 0:45 Estimate Time Interval 3500 Safety Height (RED) 22 Calculated Fuel Remaining 23 Actual Fuel Remaining
 22. Calculated Fuel Remaining. 23. Actual Fuel Remaining.")
46
POSITION REPORTING POINTS
TAKHLI ATA ETA

47
DISTANCE MARKER 10 NM interval (Normally on the right side) 40 30 20
")
48
CHECK POINTS จุดที่ใช้ตรวจสอบการบินว่าถูกต้องเพียงใด
ควรเลือกจุดที่มองเห็นได้ชัดทั้งด้านซ้ายและด้านขวาของ Track เขียนวงกลมรอบจุดนั้น เพื่อสังเกตได้ง่าย CHECK POINT

49
Estimate Time Interval Safety Height 10 Calculated Fuel Remaining
ATA ETA Magnetic Heading 15 Check Point ATA Estimate Time Interval ETA Safety Height 10 Calculated Fuel Remaining Magnetic Heading Actual Fuel Remaining 5 Estimate Time Interval ATA Safety Height Calculated Fuel Remaining ETA Actual Fuel Remaining 10 5

50
Magnetic Heading Estimate Time Interval Safety Height Calculated Fuel Remaining Actual Fuel Remaining 10 5