ดาวน์โหลดงานนำเสนอ
งานนำเสนอกำลังจะดาวน์โหลด โปรดรอ

1
Auayporn Apirakaramwong, Ph.D.
Biopharmacy II NUTRITION (1) Auayporn Apirakaramwong, Ph.D.
 Auayporn Apirakaramwong, Ph.D.")
2
Outline Introduction Nutrient Standards (Recommended dietary allowance (RDA)) Composition of the body body mass body surface Energy expenditure Nutritional requirements (Macro/micronutrients) energy from carbohydrate and fat nitrogen balance vitamins for biochemical functions mineral for physiological and biochemical functions
 energy from carbohydrate and fat. nitrogen balance. vitamins for biochemical functions. mineral for physiological and biochemical functions.")
3
Introduction (1) Definition
Food: medically, any substance that the body can take in and assimilate that will enable it to stay alive and to grow; the carrier of nourishment; socially, a more limited number of such substances defined as acceptable by each culture.

4
Introduction (2) Definition
Nutrients: components of food that are indispensable to the body’s functioning. They provide energy, serve as building material, help maintain or repair body parts, and support growth. Nutrients : water, carbohydrate, fat, protein, vitamins, and minerals

5
Introduction (3) Definition
Nutrition : the study of the nutrients in foods and in the body; sometimes also the study of human behaviors related to food. Diets : the food (including beverages) a person usually eats and drinks.
 a person usually eats and drinks.")
6
Introduction (4) Definition
Essential nutrients : the nutrients the body cannot make for itself (or cannot make it fast enough); nutrients that must be obtained from food to prevent deficiencies. Calories : unit of energy (strictly speaking, kilocalories), amount of heat energy necessary to raise temperature of a 1 kg of water 1 degree C.
; nutrients that must be obtained from food to prevent deficiencies. Calories : unit of energy (strictly speaking, kilocalories), amount of heat energy necessary to raise temperature of a 1 kg of water 1 degree C.")
7
Introduction (5) Why study nutrition
poor diet, sedentary lifestyle--> risk factor for chronic disease and death

8
Introduction (6) Leading causes of death In US (2002):
Heart disease (primarily heart attack) Cancer Stroke Chronic lower respiratory diseases Accidents (unintentional injuries) Diabetes Influenza/Pneumonia Alzheimer's disease Nephritis, nephrotic syndrome, and nephrosis (CVS) Septicemia
 Cancer. Stroke. Chronic lower respiratory diseases. Accidents (unintentional injuries) Diabetes. Influenza/Pneumonia. Alzheimer s disease. Nephritis, nephrotic syndrome, and nephrosis (CVS) Septicemia.")
9
Introduction (7) Nutritious diet: a, b, c, m, v principle: adequacy
balance calories control moderation variety

10
Nutrient Standards Nutrient standard from Dietary Reference Intakes (DRIs) committee: 4 dietary reference standards 1. Estimated Average Requirement (EAR) 2. Recommended Dietary Allowance (RDA) 3. Adequate Intake (AI) 4. Tolerable Upper Intake Level (UL)
 2. Recommended Dietary Allowance (RDA) 3. Adequate Intake (AI) 4. Tolerable Upper Intake Level (UL)")
11
Estimated Average Requirement (EAR)
The intake level estimated to meet the requirement defined by a specified indicator for 50% of people in a specific age and gender group. At this level of intake, the remaining 50% of the group would not have its needs met.

12
Recommended Dietary Allowance (RDA)
The daily level of dietary intake sufficient to meet the needs of nearly everyone (97-98%) in a specific age and gender group, This list of nutrient allowances published by Food and Nutrition Board of the National Academy of sciences.
 in a specific age and gender group, This list of nutrient allowances published by Food and Nutrition Board of the National Academy of sciences.")
13
Adequate Intake (AI) AI determined if there is not enough scientific evidence available to calculate an EAR, is based on observed or experimentally determined estimates of what appears to be an adequate intake for each specific age and gender group.

14
Tolerable Upper Intake Level (UL)
The maximum level of daily intake at which a nutrient is unlikely to pose adverse health risks for most people in a specific group.

15
Dietary Reference Intakes (DRI)
Reference values that can be used to assess diets for healthy populations. DRIs refer to at least three types of reference values: EAR, RDA and UL EAR RDA AI UL No. of people Nutrient intake

16
1 1 EAR is the intake at RDA is the intake at which the risk of
At the intake above the UL, the risk of adverse effect increase EAR is the intake at which the risk of inadequacy is 50% RDA is the intake at which the risk of inadequacy is 2-3% AI does not bear a predictable relationship to the EAR or RDA. AI is based on an estimate of nutrient intake of healthy people. 1 1 EAR RDA UL Risk of inadequacy AI Risk of adverse effect Level of nutrient intake

17
Daily Reference Value (DRV)
Dietary references for macronutrients considered energy-producing sources, including fat, saturated fat, cholesterol, carbohydrate (including fiber), protein, sodium, and potassium. The DRVs are derived from the values listed below, which describe the relative percentage of each macronutrients found in a healthy diet. Fat 30% (30)*of calories/energy intake (saturated fat 7% (10)) Carbohydrate 55-60% (60) of calories/energy intake Protein % (10) of calories/energy intake Fiber 11.5 (12.5) grams per 1000 calories *Thai DRV
, protein, sodium, and potassium. The DRVs are derived from the values listed below, which describe the relative percentage of each macronutrients found in a healthy diet. Fat 30% (30)*of calories/energy intake. (saturated fat 7% (10)) Carbohydrate 55-60% (60) of calories/energy intake. Protein 10-15% (10) of calories/energy intake. Fiber 11.5 (12.5) grams per 1000 calories. *Thai DRV.")
18
Daily Value (DV) Rough guide for comparing nutrient content of food to app. Human needs using on food label for children above the age of 4 and adults (Thai = > 6 yrs) based on a 2000-calories diet Food for children under age 2 do not carry information about calories associated with fat , unsaturated fat, polyunsaturated fat, monounsaturated fat and cholesterol because infants’ fat intake should not be restricted. When babies do not take in enough energy-much of it in the form of fat- the result can be failure to thrive.
 based on a 2000-calories diet. Food for children under age 2 do not carry information about calories associated with fat , unsaturated fat, polyunsaturated fat, monounsaturated fat and cholesterol because infants’ fat intake should not be restricted. When babies do not take in enough energy-much of it in the form of fat- the result can be failure to thrive.")
19
Reference Values for Nutrition Labeling (1) (Based on a 2000 Calorie Intake; for Adults and Children 4 or More Years of Age) NUTRIENTS DAILY VALUES Total Fat (g) Saturated fatty acids (g) Cholesterol (mg) Sodium (mg) Potassium (mg) Total carbohydrate (g) Fiber (g) Protein (g) Vitamin A (IU) Vitamin C (mg) Calcium (mg)
 Saturated fatty acids 20 (g) Cholesterol 300 (mg) Sodium 2400 (mg) Potassium 3500 (mg) Total carbohydrate 300 (g) Fiber 25 (g) Protein 50 (g) Vitamin A 5000 (IU) Vitamin C 60 (mg) Calcium 1000 (mg)")
20
Reference Values for Nutrition Labeling (2) (Based on a 2000 Calorie Intake; for Adults and Children 4 or More Years of Age) NUTRIENTS DAILY VALUES Iron (mg) Vitamin D (IU) Vitamin E (IU) Vitamin K (µg) Thiamin (mg) Riboflavin (mg) Niacin (mg) Vitamin B (mg) Folate (µg) Vitamin B (µg) Biotin (µg)
 Vitamin D 400 (IU) Vitamin E 30 (IU) Vitamin K 80 (µg) Thiamin 1.5 (mg) Riboflavin 1.7 (mg) Niacin 20 (mg) Vitamin B6 2.0 (mg) Folate 400 (µg) Vitamin B (µg) Biotin 300 (µg)")
21
Reference Values for Nutrition Labeling (3) (Based on a 2000 Calorie Intake; for Adults and Children 4 or More Years of Age) NUTRIENTS DAILY VALUES Pantothenic acid (mg) Phosphorus (mg) Iodine (µg) Magnesium (mg) Zinc (mg) Selenium (µg) Copper (mg) Manganese (mg) Chromium (µg) Molybdenum (µg) Chloride (mg)
 Phosphorus 1000 (mg) Iodine 150 (µg) Magnesium 400 (mg) Zinc 15 (mg) Selenium 70 (µg) Copper 2.0 (mg) Manganese 2.0 (mg) Chromium 120 (µg) Molybdenum 75 (µg) Chloride 3400 (mg)")
22
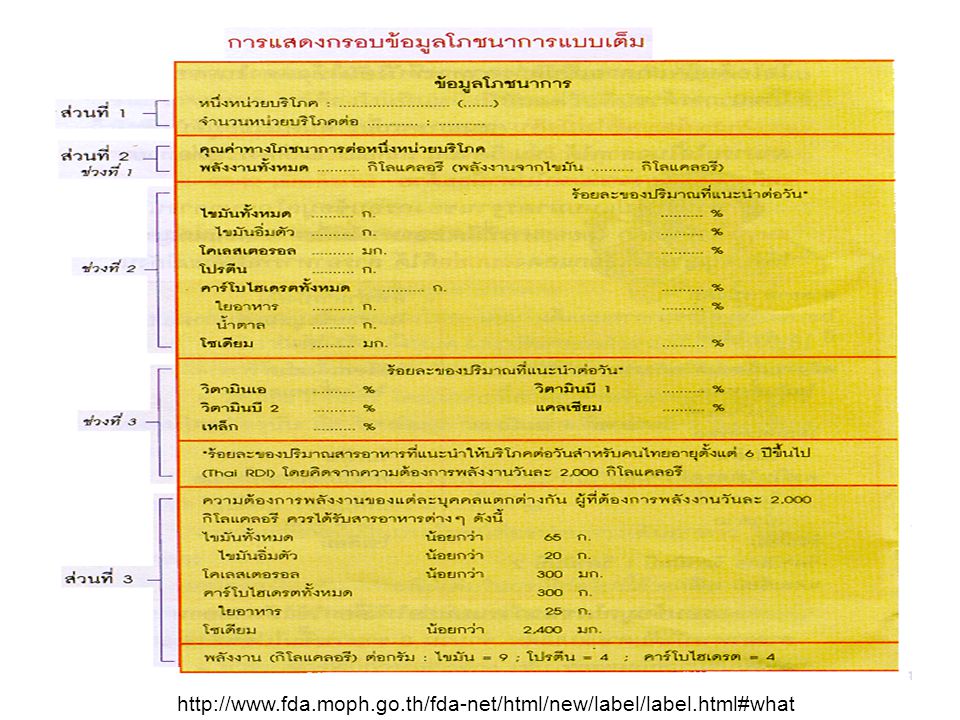
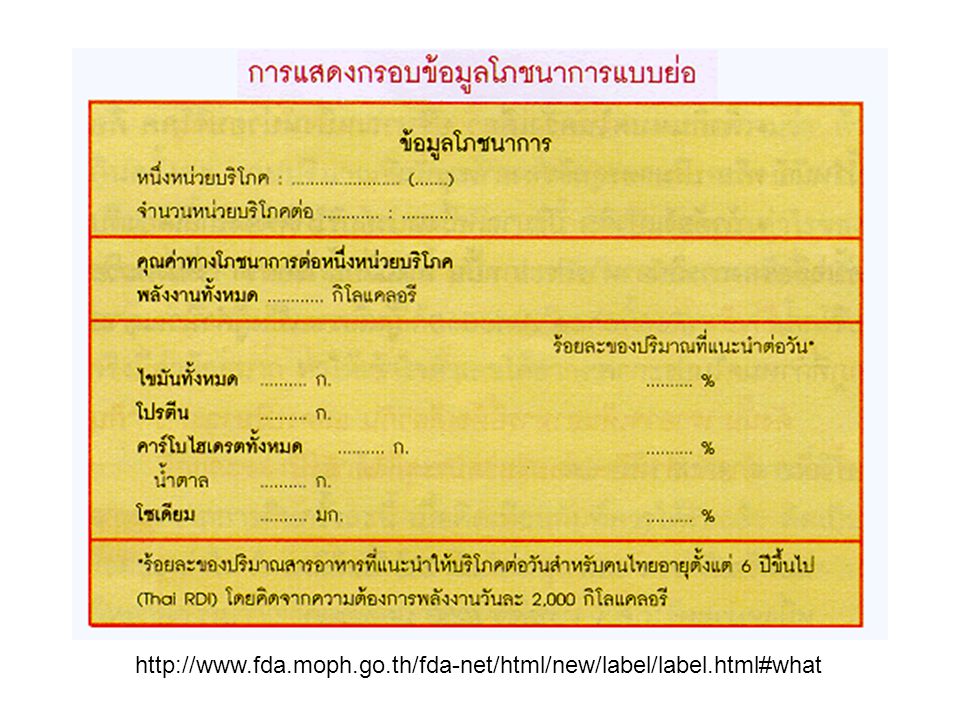
Food labels การแสดงฉลากโภชนาการ คือ การแสดงข้อมูลโภชนาการของ อาหารนั้นๆ บนฉลากในรูปของชนิด และปริมาณของสารอาหาร โดยอยู่ภายในกรอบ ที่มีรูปแบบเดียวกัน ซึ่งเรียกว่า กรอบข้อมูล โภชนาการ "กรอบข้อมูลโภชนาการ" ซึ่งระบุ ชนิดสารอาหาร ปริมาณสารอาหาร

23
ประโยชน์ของฉลากโภชนาการ
ฉลากโภชนาการช่วยให้ผู้บริโภค เลือกซื้ออาหารและเลือกบริโภคให้เหมาะสมกับความต้องการ หรือภาวะทาง โภชนาการของตนได้ เช่น เลือกอาหารที่ระบุว่ามีโคเลสเตอรอลต่ำ หรือ มี โซเดียมต่ำ เปรียบเทียบเลือกซื้อผลิตภัณฑ์อาหารชนิดเดียวกัน โดยเลือกที่มีคุณค่าทาง โภชนาการดีกว่าได้ ในอนาคต เมื่อผู้บริโภคสนใจ ต้องการข้อมูลโภชนาการของอาหาร ผู้ผลิตก็ จะแข่งขันกันผลิตอาหารที่มีคุณค่าทางโภชนาการสูงกว่า แทนการแข่งขันกัน ในเรื่องหีบห่อ สี หรือสิ่งจูงใจภายนอกอื่นๆ

24
หลักเกณฑ์การแสดงฉลากโภชนาการของ Codex
ให้ประเทศต่างๆกำหนดให้เหมาะสมกับสภาพปัญหา และภาวะทางโภชนาการ ของแต่ละประเทศ และ อาหารใดที่มีการกล่าวอ้างคุณค่า คุณประโยชน์ เช่น โปรตีนสูง ไขมันต่ำ ก็ จะต้องแสดงฉลากโภชนาการประกอบข้อกล่าวอ้างด้วย และ สารที่อนุญาตให้ระบุจะต้องเป็นสารอาหารที่มีการกำหนดค่าความต้องการต่อ วันไว้แล้วเท่านั้น คือ อนุญาตเฉพาะสารอาหารที่คุณค่า ประโยชน์และความ จำเป็นที่จะต้องได้รับ ในปริมาณที่กำหนดในแต่ละวันได้รับการยอมรับแล้วใน หมู่นักโภชนาการทั่วโลก โดยประเทศนั้นๆได้นำมาปรับกำหนดเป็นเกณฑ์ เป็น แนวในการบริโภคที่เหมาะสมสำหรับประชาชนของตนแล้ว Codex = FAO/WHO Food Standard

25
ข้อมูลที่บังคับ คือข้อมูลสารอาหารที่มีความสำคัญหลักสำหรับคนไทย ได้แก่
ปริมาณพลังงานทั้งหมด และปริมาณพลังงานที่ได้จากไขมัน คาร์โบไฮเดรต ไขมัน โปรตีน ซึ่งเป็นสารอาหารที่ให้พลังงาน วิตามิน เกลือแร่ โดยเฉพาะที่สำคัญสำหรับภาวะโภชนาการของคนไทยปัจจุบัน คือ วิตามินเอ วิตามินบี 1 วิตามินบี 2 แคลเซียม เหล็ก สารอาหารที่ต้องระวังไม่ให้กินมากเกินไป ได้แก่ โคเลสเตอรอล โซเดียม ไขมัน อิ่มตัว และน้ำตาล สารอาหารที่เป็นประโยชน์ต่อระบบทางเดินอาหาร ได้แก่ ใยอาหาร นอกจากนั้น ยังบังคับเพิ่มเติมในกรณีต่อไปนี้ด้วย คือ สารอาหารที่มีการเติมลงในอาหาร (Fortification/Nutrification) สารอาหารที่มีการกล่าวอ้าง เช่น หากระบุว่า "มีไอโอดีน" ไอโอดีนก็จะกลายเป็น สารอาหารที่บังคับให้แสดงในกรอบข้อมูลโภชนาการด้วย
 สารอาหารที่มีการกล่าวอ้าง เช่น หากระบุว่า มีไอโอดีน ไอโอดีนก็จะกลายเป็น สารอาหารที่บังคับให้แสดงในกรอบข้อมูลโภชนาการด้วย.")
26
ข้อมูลที่ไม่บังคับ (นอกจากที่กำหนดในข้อมูลบังคับ) ก็สามารถใส่ใน ฉลากได้ เช่น วิตามินเกลือแร่อื่นๆ ก็สามารถใส่ในฉลากได้ แต่ต้องระบุ ต่อท้ายจาก เหล็ก และเรียงจากมากไปหาน้อยด้วย
 ก็สามารถใส่ใน ฉลากได้ เช่น วิตามินเกลือแร่อื่นๆ ก็สามารถใส่ในฉลากได้ แต่ต้องระบุ ต่อท้ายจาก เหล็ก และเรียงจากมากไปหาน้อยด้วย")
29
Descriptive terms used on food labels (1)
Energy terms: low calorie < 40 calories/ serving reduced calorie at least 25% lower in calories than regular or reference food calorie free < 5 calories/ serving Fiber terms: high fiber > 5 g/ serving good source of fiber g/ serving more or added fiber at least 2.5 g/ serving than reference food

30
Descriptive terms used on food labels (2)
Fat and cholesterol terms: cholesterol free < 2 mg cholesterol and < 2 g sat. fat/ serving fat free < 0.5 g/ serving low cholesterol < 20 mg cholesterol and < 2 g sat. fat/ serving low fat < 3 g fat/ serving

31
Descriptive terms used on food labels (3)
Other terms: free eg. fat free, sugar free = < 0.5 g/ serving light ( 3 meanings) 1/3 calories or 1/2 fat of regular product low-calorie, low-fat food with 1/2 Na normally present light in color and texture
 1/3 calories or 1/2 fat of regular product. low-calorie, low-fat food with 1/2 Na normally present. light in color and texture.")
32
Composition of the body
Body composition and nutritional stores Lean body mass : water and protein content of the body Fat : energy store Bone : calcium and minerals vary with factors: age, gender, stage of development, physical fitness, hormonal status, pregnancy 28 wks fetus: 88% water newborn baby: 75% water 2-mo baby: 65% water 4-mo baby: 60% water

33
Estimating body composition
Normal composition of a 65 kg man: protein: 11 kg (17%) fat: 9 kg (13.8%) carbohydrate: 1 kg (1.5%) water: 40 kg (61.6%) minerals: 4 kg (6.1%) Physical measurements height and weight muscle mass and body mass: mid-arm circumference and triceps skin-fold thickness-->value > or < 10 %
 fat: 9 kg (13.8%) carbohydrate: 1 kg (1.5%) water: 40 kg (61.6%) minerals: 4 kg (6.1%) Physical measurements. height and weight. muscle mass and body mass: mid-arm circumference and triceps skin-fold thickness-->value > or < 10 %")
34
mid-arm circumference Subscapular Skinfold caliper

35
Body surface area The Mosteller¹ formula
BSA (m²) = ( [Height(cm) x Weight(kg) ]/ 3600 )½ e.g. BSA = SQRT( (cm*kg)/3600 ) The DuBois and DuBois² formula BSA (m²) = x Height(m)0.725 x Weight(kg)0.425 The Haycock³ formula BSA (m²) = x Height(cm) x Weight(kg)0.5378 The Gehan and George4 formula BSA (m²) = x Height(cm) x Weight(kg) The Boyd formula5 BSA (m2) = x Height(cm)0.3 x Weight(grams)( ( x LOG(grams) )
 = ( [Height(cm) x Weight(kg) ]/ 3600 )½ e.g. BSA = SQRT( (cm*kg)/3600 ) The DuBois and DuBois² formula. BSA (m²) = x Height(m)0.725 x Weight(kg) The Haycock³ formula. BSA (m²) = x Height(cm) x Weight(kg) The Gehan and George4 formula. BSA (m²) = x Height(cm) x Weight(kg) The Boyd formula5. BSA (m2) = x Height(cm)0.3 x Weight(grams)( ( x LOG(grams) )")
36
Lean body weight Lean Body Weight (men) = (1.10 x Weight(kg)) ( Weight2/(100 x Height(m))2) Lean Body Weight (women) = (1.07 x Weight(kg)) ( Weight2/(100 x Height(m))2)
 = (1.07 x Weight(kg)) ( Weight2/(100 x Height(m))2)")
37
Ideal body weight Ideal Body Weight (men) = ( Height (in) - 60 ) eg. H = 175 cm; 70 in W should be =73 Kg Ideal Body Weight (women) = ( Height (in) - 60 ) eg. H = 160 cm; 64 in W should be =54.7 Kg
 = ( Height (in) - 60 ) eg. H = 160 cm; 64 in. W should be =54.7 Kg.")
38
Body mass index Body Mass Index = Weight (kg) / Height (m)2 Women Men
underweight < <20.7 ideal weight marginally overweight overweight very overweight or obese > >31.1

39
Energy potential in food
Energy expenditure (1) Nutrients and energy Protein 4 kcal/g Carbohydrate 4 kcal/g Alcohol 7 kcal/g Lipid 9 kcal/g Energy Energy potential in food
 Nutrients and energy. Protein. 4 kcal/g. Carbohydrate. 4 kcal/g. Alcohol. 7 kcal/g. Lipid. 9 kcal/g. Energy. Energy potential in food.")
40
Energy expenditure (2) Amount of energy a person expends on daily basis = total energy expenditure (TEE) include : energy expended during physical activity thermic effect of food (thermogenic effect) resting metabolic rate (RMR; minimal energy necessary to sustain body temp, respiration, blood flow etc.; in resting, postabsorptive state) 70 kg man: RMR 1800 kcal 50 kg woman: RMR 1300 kcal [environmental temp]
 resting metabolic rate (RMR; minimal energy necessary to sustain body temp, respiration, blood flow etc.; in resting, postabsorptive state) 70 kg man: RMR 1800 kcal. 50 kg woman: RMR 1300 kcal. [environmental temp]")
41
Major components of energy expenditure
Fuel used to maintain basic physiological functions 100 60% % energy expenditure Fuel for physical activity Fuel to process the food we eat 30% 10% TEF Basal metabolism Physical activity

42
Factors affect RMR Body composition age fitness sex genetics
stage of growth hormone levels fever nutritional status

43
Factors affect RMR Increase RMR Decrease RMR Total body weight
large body surface area hot and cold ambient temp fever hyperthyroidism stress caffeine smoking increased lean body mass rapid growth pregnancy and lactation Decrease RMR Aging female gender fasting/starvation hypothyroidism sleep Genetics some medications

44
Approx energy expenditure of organ in adults
% RMR Liver Brain Heart Kidney 7 Skeleton muscle (rest) 18 Remainder (including bone) 17 100
 18. Remainder (including bone)")
45
Measurement of energy expenditure
Calorimetry direct calorimetry : energy use by the body by measuring heat released from organism enclosed in small insulated chamber surrounded by water --> temp of water indirect calorimetry : measured by gas exchange, oxygen uptake or carbon dioxide output

46
Estimating total energy expenditure
Harris-Benedict Equations based on age, height, weight, and sex adult men: RMR = W + 5.0H - 6.8A adult women: RMR = W + 1.8H - 4.7A TEE = 10% (RMR + EEPA) TEE = RMR + TEF + EEPA energy intake = energy output
 TEE = RMR + TEF + EEPA. energy intake = energy output.")
47
Lifetime variation in nutritional requirements
Infants: mother’s milk (4 mo) WHO recommends breast feeding for 6 mo: Fe, I may be inadequate 1-3 yrs 4-10 yrs 11-18 yrs adults yrs pregnant women lactating women adults 50+ yrs
 WHO recommends breast feeding for 6 mo: Fe, I may be inadequate. 1-3 yrs yrs yrs. adults yrs. pregnant women. lactating women. adults 50+ yrs.")
48
Nutritional requirements
energy from carbohydrate and fat carbohydrate = 4 kcal/g, fat = 9 kcal/g nitrogen balance protein = 4 kcal/g positive/negative nitrogen balance vitamins for biochemical functions co-enzymes mineral for physiological and biochemical functions macronutrients/micronutrients

49
Dietary Carbohydrates
Monosaccharide, di-, oligo-, polysaccharide sugar alcohols: abs slowly than sugar sorbitol, manitol, lactitol, xylitol :sweetener complex carbohydrate: polysaccharides, dietary fiber or non-starch polysaccharide (plant cell wall) cellulose, pectins, gums, mucilage lignin, cutins and waxes an apple a day keeps the doctor aways
 cellulose, pectins, gums, mucilage. lignin, cutins and waxes. an apple a day keeps the doctor aways.")
50
Dietary fiber Soluble fiber: fibers form a viscous gel when mixed with a liquid pectin, gum, mucilage Insoluble fiber: hemicellulose, lignin

51
Actions of dietary fiber
Reduces constipation and hemorrhoid formation, soften stools Increases bowel motility, thus reducing exposure of gut to carcinogens Decreases absorption of dietary fat and cholesterol; increases fecal loss of cholesterol (lower LDL cholesterol level) Delays gastric emptying; generates sensation of fullness; reduces postprandial blood glucose concentration
 Delays gastric emptying; generates sensation of fullness; reduces postprandial blood glucose concentration.")
52
Foods rich in soluble dietary fiber
fruits: apple, cranberries, grapefruit, mango, oranges vegetables: asparagus, broccoli, brussels sprouts, carrots nuts and seeds: peanuts, pecans, walnuts legumes: most legumes grains: oat bran, oatmeal, psyllium

53
Foods rich in insoluble dietary fiber
fruits: apple, banana,berries, cherries, pears vegetables: broccoli, green peppers, red cabbage, spinach nuts and seeds: almonds, sesame seeds, sunflower seeds legumes: most legumes grains: brown-rice, whole-wheat breads, wheat-bran cereals

54
Dietary carbohydrate and blood glucose
Glycemic index: the area under the blood glucose curves seen after ingestion of a meal with carbohydrate-rich food, compared with the area under the blood glucose curves observed after a meal consisting of the same amount of carbohydrate in the form of glucose or white bread. 140 High glycemic index Blood glucose (mg/dL) 70 Low glycemic index Minutes after ingestion of food
 70. Low glycemic index. Minutes after ingestion of food.")
55
Clinical importance of Glycemic index
Controversial food with low glycemic index-->create a sense of satiety over a longer period of time, may helpful in limiting caloric intake high, moderate, low GI Glycemic index high in sticky rice

56
Requirements of carbohydrates
RDA 130 g/d Thai 300 g; fiber 25 g 55-60% of total energy from carbohydrates recommendation: added sugar > 10% of total energy (Thai RDA; USA 25%)
")
57
Sweeteners Nutritive sweeteners Non-nutritive sweetener
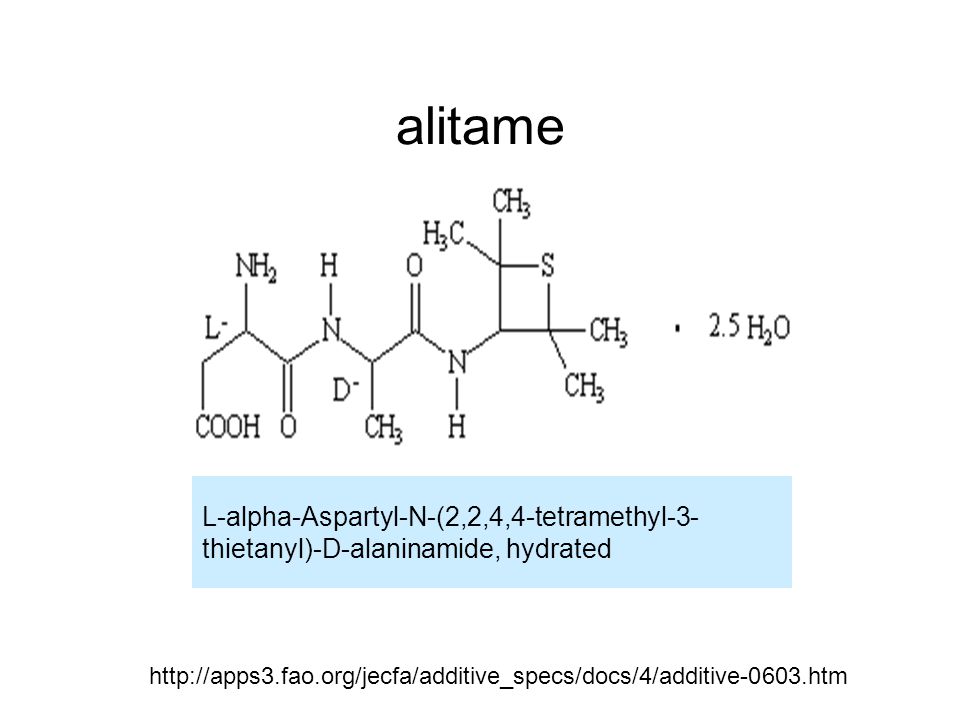
natural sweeteners: honey, maple syrup refined sweeteners: mono-, disacch. Extract from plant foods: table sugar (sucrose), glucose, fructose sugar alcohol artificial sweeteners: saccharin ADI = 5 mg/kg (300x sucrose)-bladder cancer, aspartame-ADI = 50 mg/kg, acesulfame-K-ADI = 15 mg/kg (200x sucrose) heat dose not destroy alitame (2000x sucrose): Ala+Asp D-tagatose derive from lactose Non-nutritive sweetener sucralose (SplendaR): made from sucrose (600x sucrose)
, glucose, fructose. sugar alcohol. artificial sweeteners: saccharin ADI = 5 mg/kg (300x sucrose)-bladder cancer, aspartame-ADI = 50 mg/kg, acesulfame-K-ADI = 15 mg/kg (200x sucrose) heat dose not destroy. alitame (2000x sucrose): Ala+Asp. D-tagatose derive from lactose. Non-nutritive sweetener. sucralose (SplendaR): made from sucrose (600x sucrose)")
58
alitame L-alpha-Aspartyl-N-(2,2,4,4-tetramethyl-3- thietanyl)-D-alaninamide, hydrated
59
Carbohydrates and health
Diabetes militus Dental caries complex carbohydrates : decrease risk of obesity type 2 DM cancer: colon CVS disease--fiber can lower cholesterol level GI disorders: constipation, hemorrhoid

60
Lipids Triacylglycerol: fat and oil
2% of dietary lipids = phospholipid small % = sterols : cholesterol, corticol, vit D saturated, monounsaturated, polyunsaturated FA-->solid, liquid form in r.t. stearic acid (C-18 sat) in chocolate, meat fat olive oil (C-18 monounsat= oleic acid) soybean oil (C-18 diunsat = linoleic acid) Thai RDA: total fat 65 g, sat fat 20 g, chlesterol 300 mg
 in chocolate, meat fat. olive oil (C-18 monounsat= oleic acid) soybean oil (C-18 diunsat = linoleic acid) Thai RDA: total fat 65 g, sat fat 20 g, chlesterol 300 mg.")
61
Eicosanoids, omega-3, omega-6 FA
Omega-6s: first db begin at 6th carbon linoleic acid (18:2; ,12) :essential FA lower plasma LDLs and HDLs nuts, avocados, olives, soybeans and various oils: sesame, cottonseed, corn oil Omega-3s: first db begin at 3rd carbon lenolenic acid (18:3; 9,12,15) :essential FA suppress cardiac arrythmias, reduce serum triglycerides little effect on LDL, HDL cholesterol levels fish oil (docosaheaenoic acid, DHA; eicosapentaenoic acid, EPA)
 :essential FA. lower plasma LDLs and HDLs. nuts, avocados, olives, soybeans and various oils: sesame, cottonseed, corn oil. Omega-3s: first db begin at 3rd carbon. lenolenic acid (18:3; 9,12,15) :essential FA. suppress cardiac arrythmias, reduce serum triglycerides. little effect on LDL, HDL cholesterol levels. fish oil (docosaheaenoic acid, DHA; eicosapentaenoic acid, EPA)")
62
Eicosanoids, omega-3, omega-6 FA
Source of Omega-6s: seeds, nut, vegetable oils source of Omega-3s: linseed oil, soybean oil, canola oil, walnut EPA and DHA : fish oil (salmon, mackerel, anchovie, sardine, herring, tuna,) requirement: omega-6: 2% of calories omega-3: should be 1.3% of calories
 requirement: omega-6: 2% of calories. omega-3: should be 1.3% of calories.")
63
Eicosanoids, omega-6 FA Arachidonic acid (20:4, n-6)
Seed oils from diet Arachidonic acid (20:4, n-6) cyclooxygenase lipoxygenase PGH2 Leukotrienes PGI2 ,PGD2, PGE2 , PGF2 TXA2 Platelet: aggregation effect Epithelia: inhibit aggregation
 cyclooxygenase 5-lipoxygenase. PGH2. Leukotrienes. PGI2 ,PGD2, PGE2 , PGF2. TXA2. Platelet: aggregation effect. Epithelia: inhibit aggregation.")
64
Eicosanoids, omega-3 FA Eicosapentaenoic acid (20:5, n-3)
Fish oils from diet Eicosapentaenoic acid (20:5, n-3) cyclooxygenase lipoxygenase PGH3 Leukotrienes PGI3 ,PGD3, PGE3 TXA3 Platelet: weak aggregation Epithelia: strongly inhibit aggregation
 cyclooxygenase 5-lipoxygenase. PGH3. Leukotrienes. PGI3 ,PGD3, PGE3. TXA3. Platelet: weak aggregation. Epithelia: strongly inhibit aggregation.")
65
Trans fatty acid COO- COO-
Trans FA (hydrogenation of liquid vegetable oil eg. margarine behave like sat FA elevate serum LDL increase risk of CHD H H H H Trans Cis

66
Dietary cholesterol Food: highest in brain, high in liver, moderate in meat dairy product : butterfat portion, egg yolk, breast milk dietary cholesterol has little influence on plasma chloesterol

67
Fat substitutes Generally: starch, fiber
examples: olestra= sucrose polyester, not absorb, may cause symptom of fat malabsorption

68
Fat and health Obesity Heart diseases Total cholesterol: <200 mg/dL
LDL-cholesterol : < 100 mg/dL HDL-cholesterol : > mg/dL Triglyceride : < 150 mg/dL

69
Fat and supplements EPA, DHA in fish oil capsule
Lecithin (mixture of phospholipid) CLA (conjugated linoleic acid): linoleic acid with only one saturated bond b/w its two double bonds DHEA (dihydroepiandrosterone) : antiaging
 CLA (conjugated linoleic acid): linoleic acid with only one saturated bond b/w its two double bonds. DHEA (dihydroepiandrosterone) : antiaging.")
70
Protein and Amino acids
Essential amino acids:His, Ile, Lys, Met, Phe, Thr, Trp, Val Conditionally essential amino acids: Arg, Cys, His, Tyr

71
Functions of protein Structure Transport Channels and pumps Enzymes
Hormones Antibodies Acid-base balance Fluid balance

72
Nitrogen balance Intake = output positive negative equilibrium
RDA for protein (adult) : 0.8 g/kg BW or 58 g (male), 46 g (female) Thai RDA : 50 g
 : 0.8 g/kg BW or 58 g (male), 46 g (female) Thai RDA : 50 g.")
73
Protein quality (1) Protein Digestibility Corrected Amino Acid Scoring (PDCAAS) highest score = 1 Complete proteins: red meat, poultry, fish, egg, milk and milk products

74
Protein quality (2) Protein PDCAAS Egg, milk 1.00
Beef, fish, poultry Gelatin Soybean Kidney bean Whole wheat bread 0.40

75
Protein quality (3) gelatin lack of Trp
soybean protein (less Cys) = complete protein complementary protein : pasta low in Lys; high in Met & Cys kidney bean low in Met & Cys; high in Lys
 = complete protein. complementary protein : pasta low in Lys; high in Met & Cys. kidney bean low in Met & Cys; high in Lys.")
76
Protein and amino acids as additives and supplements
Gelatin added to yogurt, filling Casein added to frozen dessert topping MSG : flavor enhancer Lys for cold sore Trp for pain relieve-->reason?

77
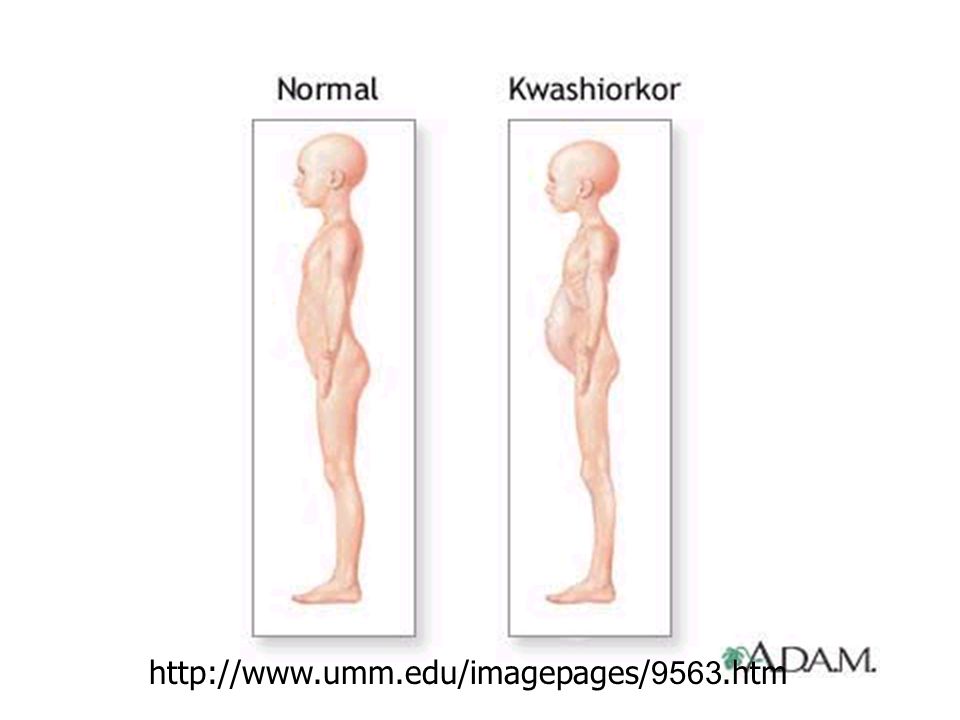
Protein and Health Malnutrition Kwashiorkor : protein deficiency
Stunted growth, edema, skin lesions, depigmented hair, anorexia, enlarged fatty liver, decreased plasma albumin Marasmus : protein and energy deficiency

79
Protein and Health Excess dietary protein kidney function
protein from animal (rich in S-containing amino acid, acidic) tend to draw Ca out of body, increase of urinary Ca increase risk of nephrolithiasis and osteoporosis obesity, heart disease cancer (colon, breast, prostate, pancreas)
 tend to draw Ca out of body, increase of urinary Ca increase risk of nephrolithiasis and osteoporosis. obesity, heart disease. cancer (colon, breast, prostate, pancreas)")
80
References Champe PC, Harvey RA, and Ferrier DR. Lippincott’s Illustrated review: Biochemistry, Lippincott Williams &Wilkins, Philadelphia, 2005, pp Mayer PA, Nutrition in Harper’s Biochemistry, 24th ed., Prentice Hall, New Jersey,1996, pp Insel P, Turner RE, and Ross D, Nutrition, Jone and Bartlett Publishers, Boston, 2002. ประกาศกระทรวงสาธารณสุข (ฉบับที่ 182 ) พ.ศ เรื่อง ฉลาก โภชนาการ
 พ.ศ.2541 เรื่อง ฉลาก โภชนาการ.")
งานนำเสนอที่คล้ายกัน