ดาวน์โหลดงานนำเสนอ
งานนำเสนอกำลังจะดาวน์โหลด โปรดรอ

1
สัมมนาเศรษฐศาสตร์ การพัฒนา Seminar in Development Economics ศ 469 / EC469 ภาคเรียนที่ 2/2553 กิริยา กุลกลการ

2
กำหนดการบรรยาย ครั้งที่ 1 (8 พฤศจิกายน ) ◦ การเรียน การสอน และการวัดผล ◦ ความเหลื่อมล้ำทางเศรษฐกิจและทางออกประเทศไทย แนวคิดทางทฤษฎี สถานการณ์ความเหลื่อมล้ำทางเศรษฐกิจในประเทศไทย ครั้งที่ 2 (15 พฤศจิกายน ) ◦ วิธีการทำวิจัย การเขียนงานวิจัย และการนำเสนองานวิจัย ครั้งที่ 3 (22 พฤศจิกายน ) ◦ อบรมวิธีการสืบค้นเอกสาร และการอ้างอิง โดย บรรณารักษ์
 ◦ การเรียน การสอน และการวัดผล ◦ ความเหลื่อมล้ำทางเศรษฐกิจและทางออกประเทศไทย แนวคิดทางทฤษฎี สถานการณ์ความเหลื่อมล้ำทางเศรษฐกิจในประเทศไทย ครั้งที่ 2 (15 พฤศจิกายน ) ◦ วิธีการทำวิจัย การเขียนงานวิจัย และการนำเสนองานวิจัย ครั้งที่ 3 (22 พฤศจิกายน ) ◦ อบรมวิธีการสืบค้นเอกสาร และการอ้างอิง โดย บรรณารักษ์")
3
“ ความเหลื่อมล้ำทาง เศรษฐกิจ กับทางออกประเทศ ไทย ”

4
Income Inequality How to measure inequality? Why should we care? What can we do about it?

5
4 criteria for inequality measurement Anonymity Principle ◦It doesn’t matter who earns the income. Population Principle ◦Cloning the entire population should not alter inequality. Relative Income Principle ◦Scaling everyone’s income up or down by the same percent shouldn’t change inequality. Dalton’s Transfer Principle ◦A transfer of income from a poorer person i to a richer person j must increase inequality.

6
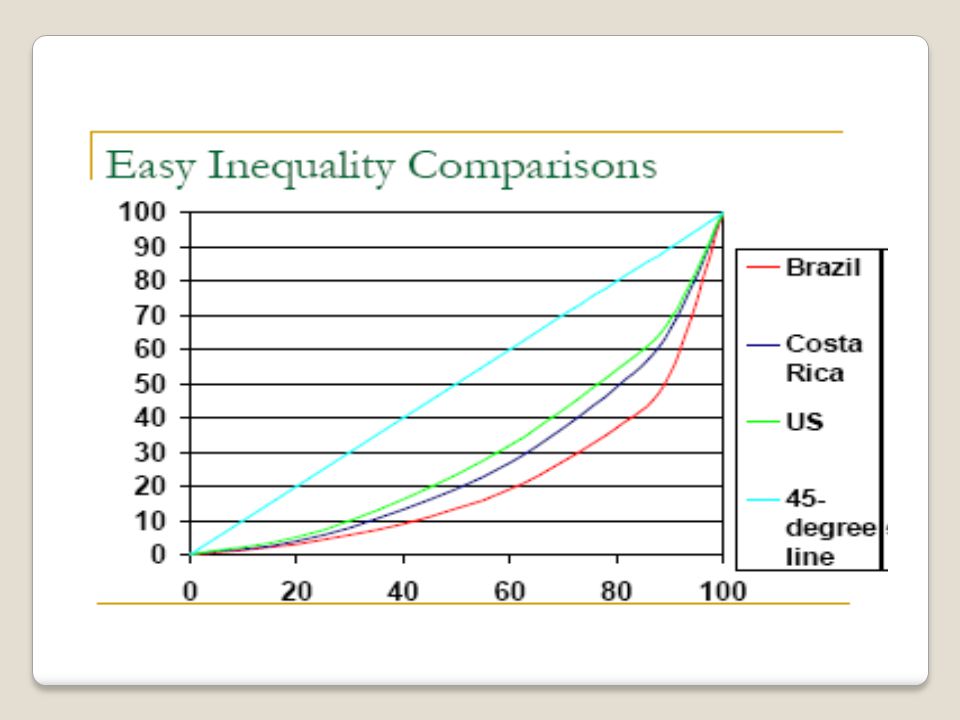
Lorenz Curve

8
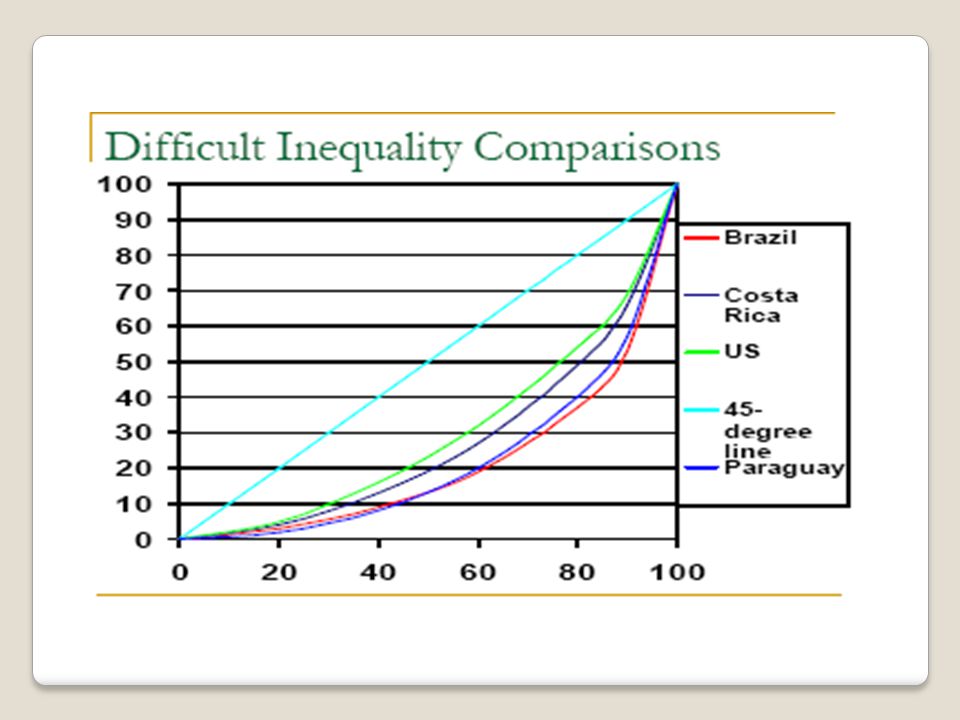
Lorenz Criterion – if a Lorenz curve lies at every point to the right of another Lorenz curve, then that distribution is more unequal.

10
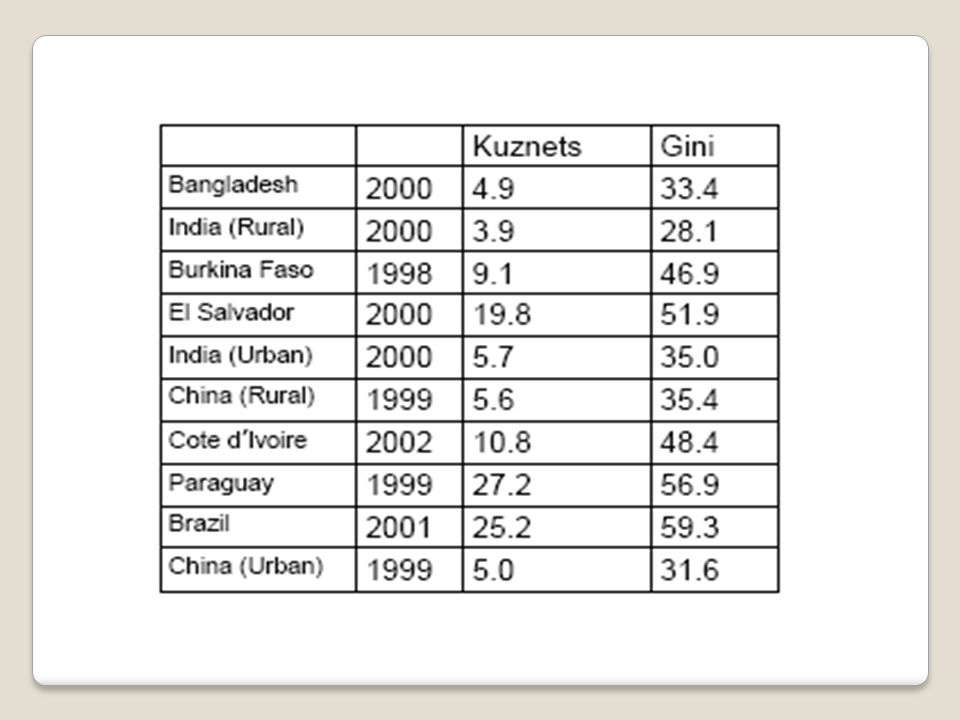
Inequality Measures Ranges = (y h -y l )/y bar Kuznets Ratio = ratio of share of income earned by the richest x% to the share of the poorest y% MAD – Mean absolute deviation These 3 measures don’t satisfy Dalton. Gini coefficient ◦Graphically, it is the area between the Lorenz curve and the 45 degree line divided by the area below the 45-degree line.

11
Person (j)yjyj 114 223 383 494 N=4MAD=14/20
yjyj N=4MAD=14/20")
12
MAD increase from 14/20 to 16/20 if guy 2 gives $1 to guy 4. Person (j)yjyj 114 214 383 4105 N=4MAD=16/20
yjyj N=4MAD=16/20.")
13
MAD stays 14/20 if guy 1 gives $1 to guy 2. Person (j)yjyj 105 232 383 494 N=4MAD=14/20 MAD will work for Dalton if we transfer money from below mean to above mean.
yjyj N=4MAD=14/20 MAD will work for Dalton if we transfer money from below mean to above mean..")
14
Gini: Gini: Person (j)yjyj 110+1+7+8=16 221+0+6+7=14 387+6+0+1=14 498+7+1+0=16 N=460/(2*16*5) =60/160
yjyj = = = =16 N=460/(2*16*5) =60/160")
15
Gini: increase from 60/160 to 68/160 if guy 2 give $1 to guy 4 Gini: increase from 60/160 to 68/160 if guy 2 give $1 to guy 4 Person (j)yjyj 110+0+7+9=16 21 387+7+0+2=16 4109+9+2+0=20 N=468/(2*16*5) =68/160
yjyj = = =20 N=468/(2*16*5) =68/160")
16
Gini: increase from 60/160 to 64/160 if guy 1 give $1 to guy 2 Gini: increase from 60/160 to 64/160 if guy 1 give $1 to guy 2 Person (j)yjyj 100+3+8+9=20 233+0+5+6=14 388+5+0+1=14 499+6+1+0=16 N=464/(2*16*5) =64/160
yjyj = = = =16 N=464/(2*16*5) =64/160")
18
Inequality vs Inequity Is inequality of outcomes the right thing to measure? ◦If one person studies hard and get an A and the other parties and gets a C, is that bad? ◦Why would you ever work hard if everyone always ended up with the same amount of money? Inequality in opportunities is much more socially unjust.

19
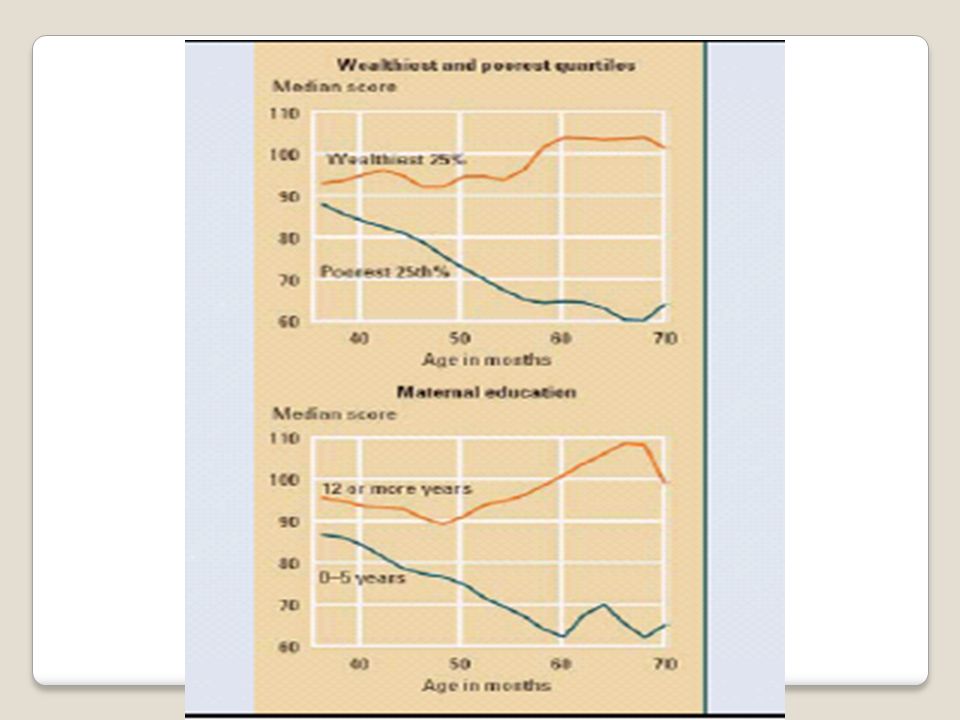
Study done in Ecuador looking at cognitive development of Ecuadorean children ages 3-6 using vocabulary recognition test. Youngest children perform broadly the same regardless of wealth or maternal education. Poor kids do way worse by age 6. Huge disadvantage at an early age.

21
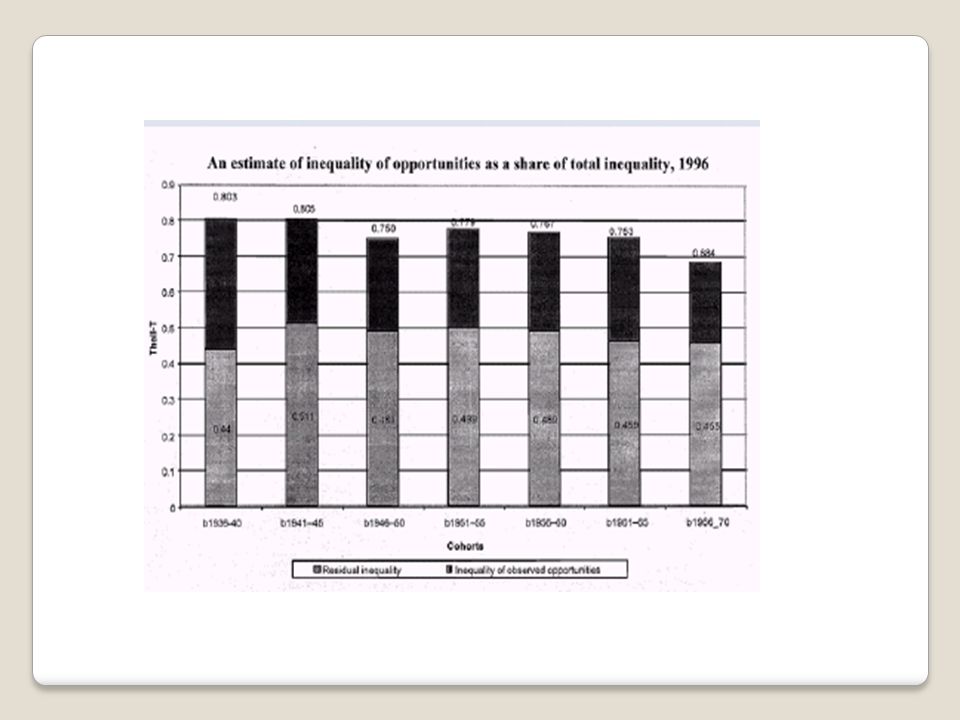
Study done in Brazil decomposing total inequality into a component based on observed opportunities and a residual. Define opportunities as the circumstances lying beyond an individual’s control. How do you measure it? Regress log of wages on a constant, race, parental schooling, father’s occupation, region of birth, plus years of own schooling and whether or not they migrated.

22
The first ones represent opportunity while the last two represent effort. Look at people in 1996 in different age groups. The bars are total inequality with inequity on the top. For the older cohorts inequity is around 41% of total inequality. For the younger cohorts inequity is around 36%. Slight decrease over time. Probably an underestimate since it doesn’t control for lots of things like sex, school quality, family health, etc.

24
Why should we care? Fairness – utility functions value a unit increase in the income of a poor person more than the same increment going to a richer person ◦Experimental evidence: Ultimatum Game ◦Survey in 69 countries Relative income is important for ideas about fairness.

27
Saving S=>I=>Growth Draw a graph with savings on the y-axis and income on the x-axis. If it is convex, inequality is good for growth. If it is concave, inequality is bad for growth. What about if it looks more like an S? For poor countries, inequality is good for growth. For rich countries, inequality is bad for growth.

28
Internal bounds

29
Underinvestment in small industries

30
Underinvestment in agriculture

32
Political redistribution Inequality => median voter will be poor and will vote for a high progressive tax =>the rich won’t have an incentive to work hard => retard growth Inequality => social tensions => political instability => discourage investment Inequality => the elite may have leeway to choose strategies benefitting themselves rather than the whole population

33
Institutional quality Look at ex-colonies. Places rich in 1500 are poor now and vice-versa. (Aztecs in Mexico and Incas in Peru versus US and NZ) Why? In places with lots of native workers =>Europeans opted for extractive institutions => discourage growth In places where Europeans settled in large number => set up good institution => encourage growth
 Why. In places with lots of native workers =>Europeans opted for extractive institutions => discourage growth In places where Europeans settled in large number => set up good institution => encourage growth.")
35
What can we do? Early child development programs Basic education and health initiatives Land access policies Equitable justice systems Unemployment, health and crop insurance Microfinance Tax reform Social welfare

36
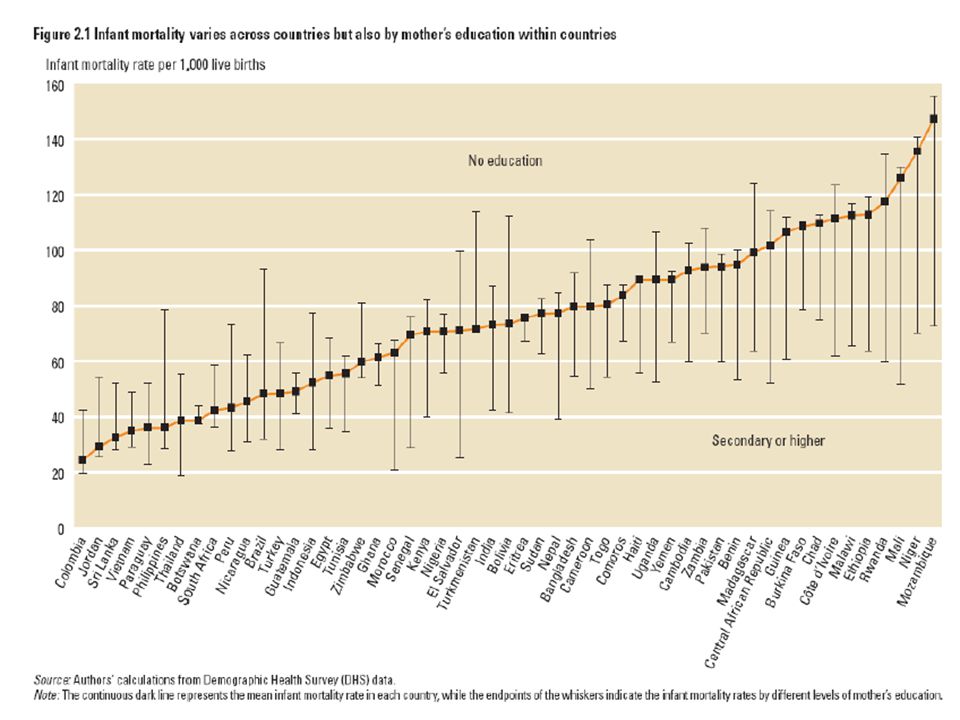
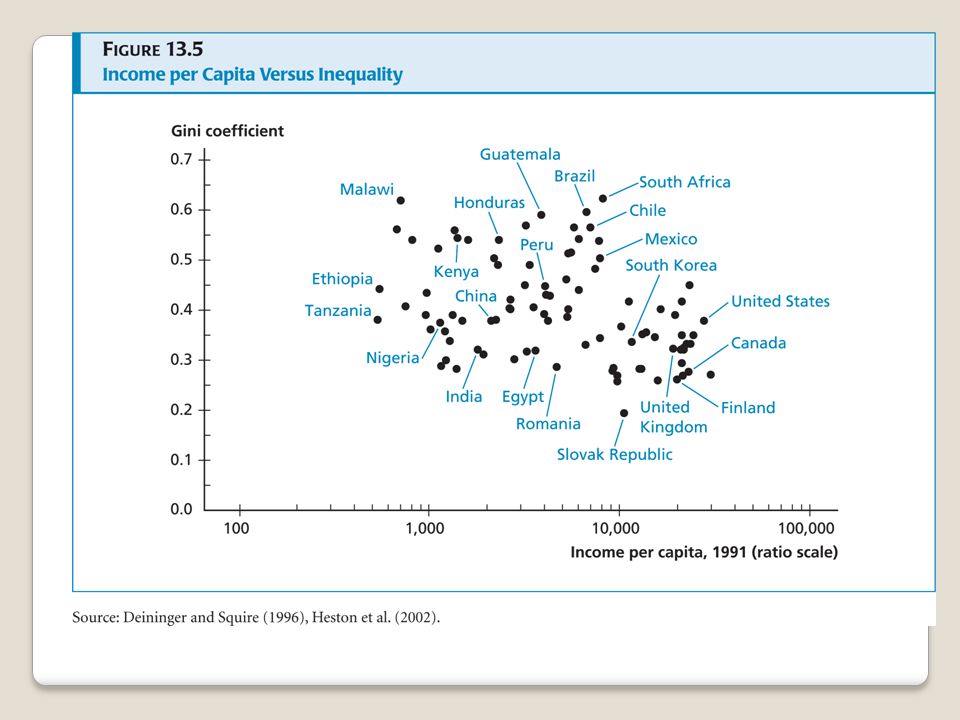
Distribution of Living Standards in the Contemporary World Variation in Infant Mortality Income Inequality Within and Between Countries ◦Income is very unequally distributed across the world. In 2000, the richest 20% of 6.1 billion world population have 74% of the income. The poorest 20% have only 2% of the income.

48
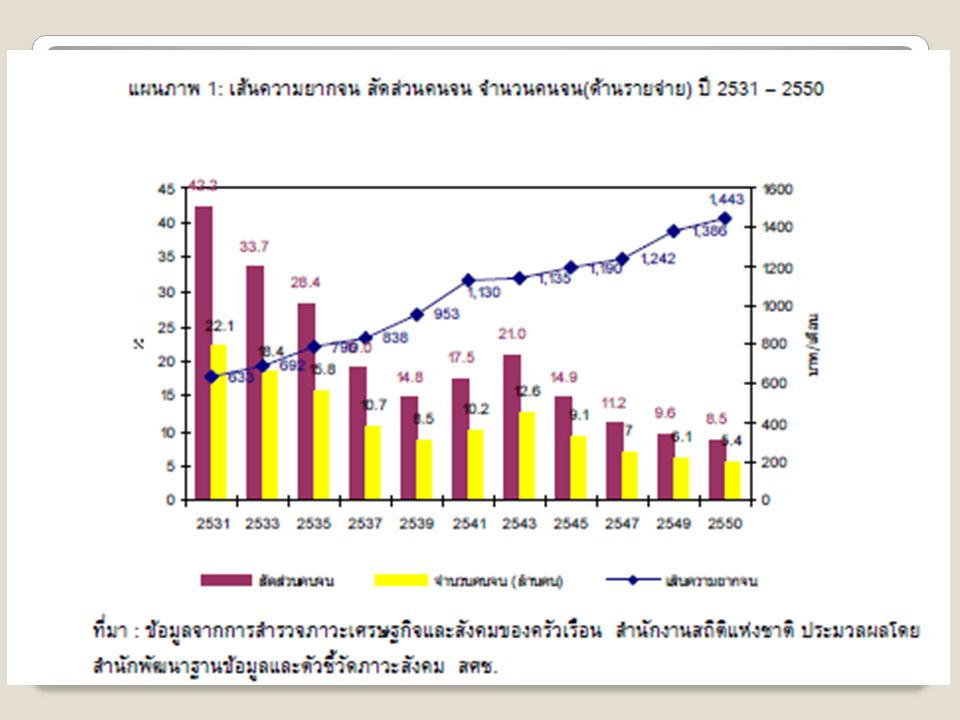
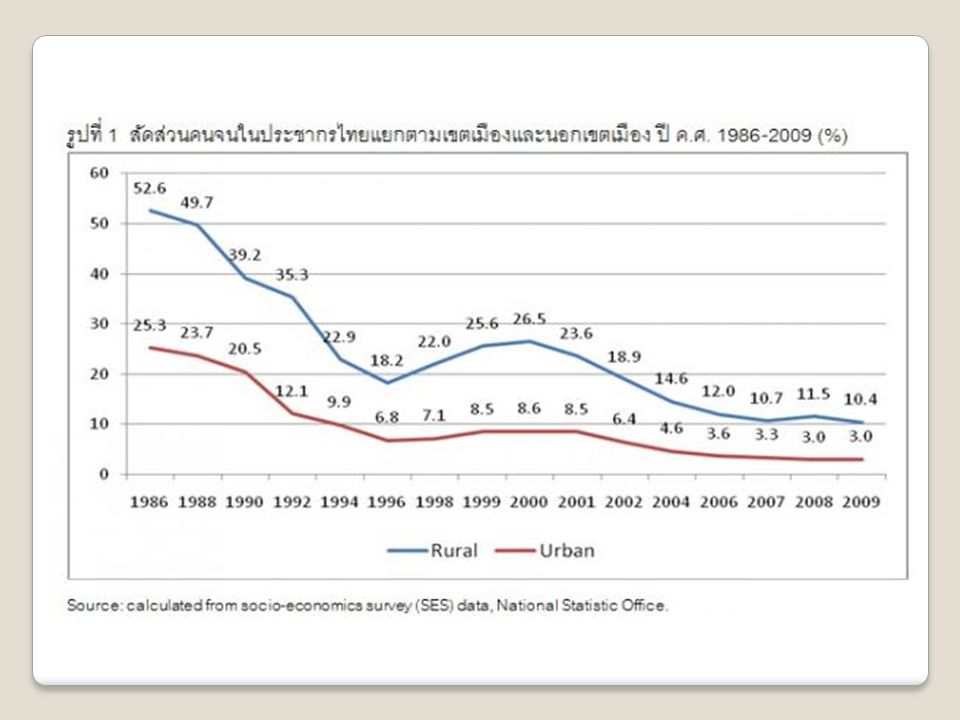
Poverty and Income Inequality in Thailand Thailand has grown economically at the satisfactory annual rate of 7%, its achievements in terms of income inequality have been less successful. การพัฒนาของเศรษฐกิจไทยนับตั้งแต่ช่วงปี 2530 เป็นต้นมา ส่งผลให้ความยากจนลดลงอย่างมาก จากกว่า 22 ล้านคนในปี 2531 หรือคิดเป็น 42.3% ของประชากรทั้งประเทศ ลดลงเหลือเพียง 8.5 ล้านคน หรือคิดเป็น 5.4% ของประชากรทั้ง ประเทศในปี 2550 From UNDP ’ s 2006 report, Thailand was ranked 74 th in income distribution from a total of 177 countries and a Gini Index of 42.

49
Poverty in Thailand Poverty line from NESDB ◦1994 838 baht/month ◦2004 1242 baht/month ◦2007 1443 baht/month (Bangkok 2065 Baht/month) The poor 5.4 million (8.5%) by HCR The poorest region ◦N/E of Thailand (2.8 million, 52.2%) ◦Highest density of poor people - Mae Hong Son (67%)
 The poor 5.4 million (8.5%) by HCR The poorest region ◦N/E of Thailand (2.8 million, 52.2%) ◦Highest density of poor people - Mae Hong Son (67%)")
51
Poverty in Thailand Poverty Index 19881990199219941996199820002002200420062007 Poverty Line (Baht/person/ month) 633 692 790 838 953 1,130 1,135 1,190 1,242 1,3861,443 No. of poor people (millions) 22.1 18.4 15.8 10.7 8.5 10.2 12.6 9.1 7.0 6.15.4 HCR (%) 42.21 33.69 28.43 18.98 14.75 17.46 20.98 14.93 11.16 9.558.48 Poverty Gap Ratio 11.40 8.05 6.62 3.92 2.85 3.35 4.24 2.75 2.01 1.811.45 SPG or Severity of poverty 4.30 2.82 2.23 1.22 0.85 0.99 1.30 0.81 0.56 0.530.41 ที่มา : ข้อมูลจากการสำรวจภาวะเศรษฐกิจและสังคมของครัวเรือน สำนักงานสถิติแห่งชาติ ประมวลผลโดย สำนักพัฒนาเศรษฐกิจชุมชนและการกระจายรายได้ สศช.
 HCR (%) Poverty Gap Ratio SPG or Severity of poverty ที่มา : ข้อมูลจากการสำรวจภาวะเศรษฐกิจและสังคมของครัวเรือน สำนักงานสถิติแห่งชาติ ประมวลผลโดย สำนักพัฒนาเศรษฐกิจชุมชนและการกระจายรายได้ สศช..")
54
การกระจายรายได้ของประชาชน ไทย

55
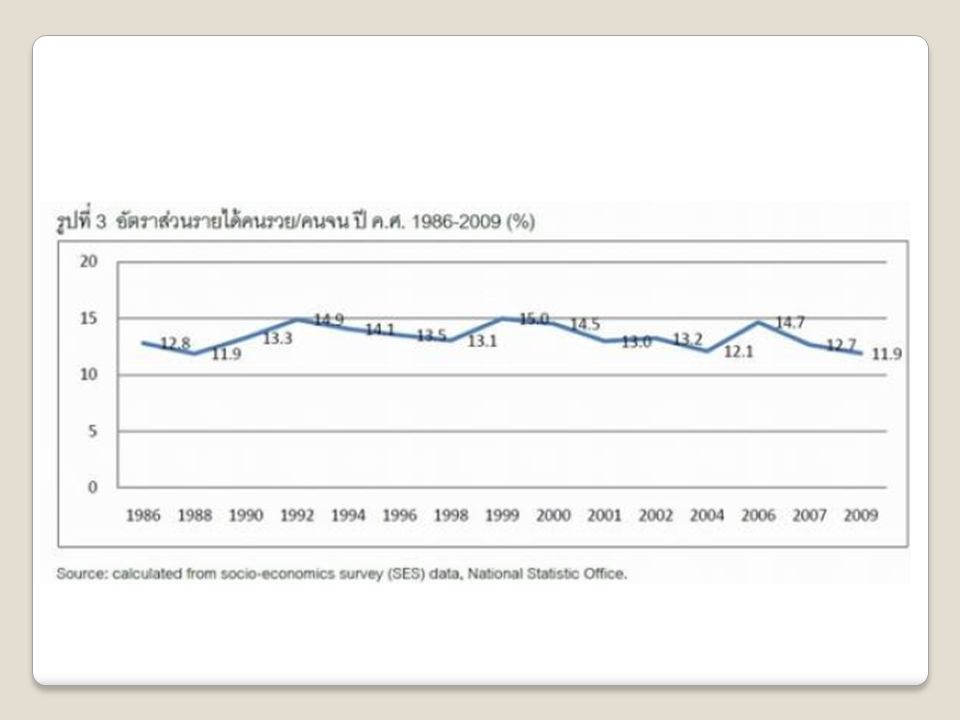
ญี่ปุ่นและประเทศกลุ่มสแกนดิเนเวีย : 3-4 เท่า, ประเทศอื่นๆ ในทวีปยุโรปและอเมริกาเหนือ : 5-8 เท่า ประเทศในภูมิภาคเอเชียตะวันออกเฉียงใต้ : 9-11 เท่า

57
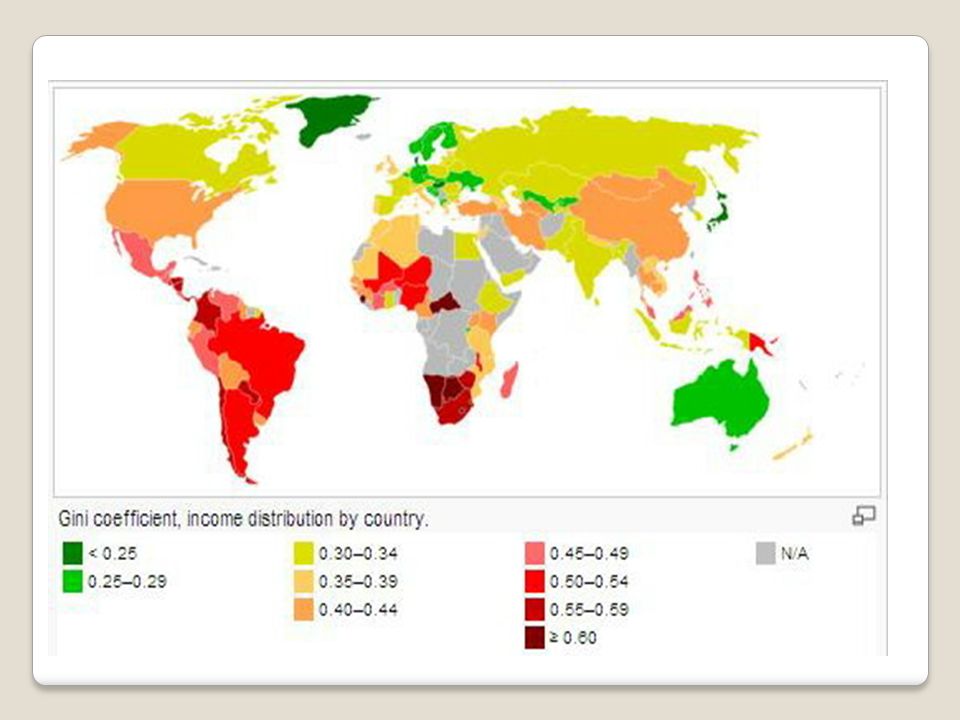
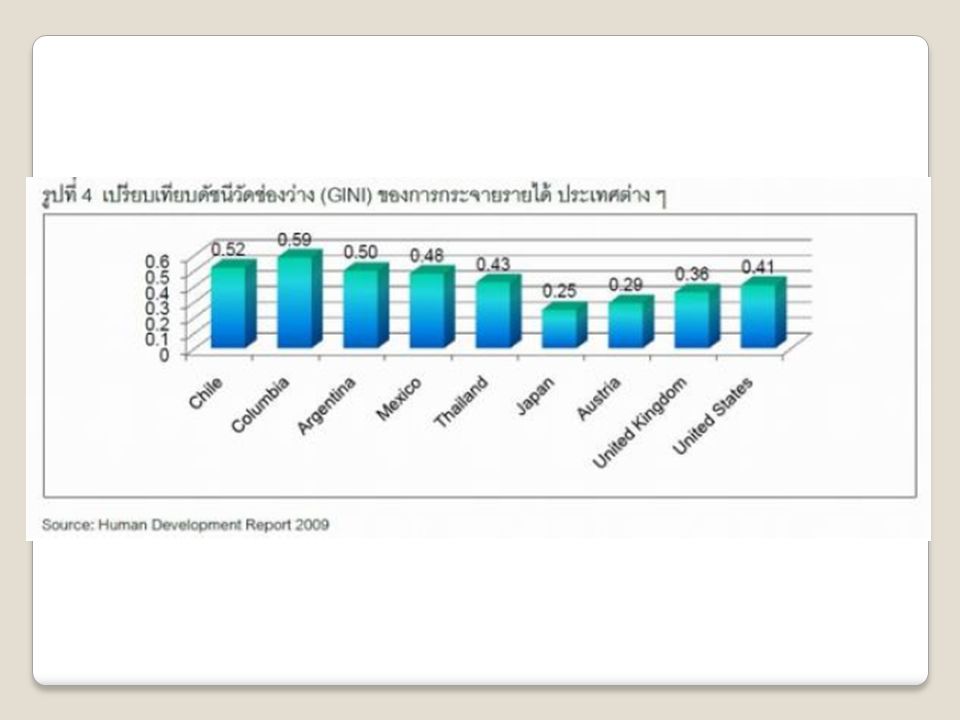
ประเทศที่ประสบความสำเร็จในการกระจายรายได้ มีค่า Gini Coefficient อยู่ที่ประมาณ 0.25-0.3 เท่านั้น

59
การกระจายรายได้ของประชาชนไทย เมื่อวัด จาก Gini coefficient ( ปี 1960-2005) ที่มา : รายงานการพัฒนาคนของประเทศไทยปี 2552 ของ UNDP อ้างจากข้อมูลของ Hal Hill
 ที่มา : รายงานการพัฒนาคนของประเทศไทยปี 2552 ของ UNDP อ้างจากข้อมูลของ Hal Hill")
60
Thailand’s income inequality

61
ระหว่างกลุ่ม กลุ่มผู้มีรายได้ต่ำสุด 20% มีรายได้ รวมกันแค่ 4-5% ในขณะที่ กลุ่มคนที่มีรายได้ สูงสุดของประเทศ 20% มีรายได้รวมกันอยู่ ประมาณ 55% เกินกว่าครึ่งหนึ่งของรายได้ทั้ง ประเทศ ระหว่างจังหวัด ในปี 50 ครัวเรือนที่อยู่ใน กรุงเทพมีรายได้ 39,000 บาท / ปี บางจังหวัด เช่น นครพนม ศรีษะเกษ มีรายได้ประมาณ 10,000- 11,000 บาท / เดือน ขณะที่แม่ฮ่องสอนจนสุดของ ไทยมีรายได้ 7,250 บาท / เดือน ระหว่างเวลา ในช่วง 20 ปีที่ผ่านมา ผลของความ เจริญที่เกิดขึ้นกระจุกอยู่ในมือของคนรวยเท่านั้น โดยกลุ่มคนที่จนสุด 20% มีรายได้ต่อคนเพิ่มจาก 244 เป็น 1,228 บาท / เดือน หรือเพิ่ม 980 บาท / เดือน ในขณะที่กลุ่มคนที่รวยสุด 20% มีรายได้ เพิ่มจาก 2,897 เป็น 15,248 บาท / เดือน หรือเพิ่ม 12,351 บาท / เดือน มากกว่าเกือบ 12 เท่า

62
สาเหตุของความเหลื่อมล้ำและ ทางออก …

63
สภาพปัญหา แนวคิดทางทฤษฎี วิเคราะห์นโยบายที่ประเทศไทยใช้ นโยบายที่ใช้ในต่างประเทศ ข้อเสนอแนะเชิงนโยบาย Outline งานวิจัย

งานนำเสนอที่คล้ายกัน


 98.08% 100.02% จังหวัด.>")


 MICU 68% CCU 32%>")


