ดาวน์โหลดงานนำเสนอ
งานนำเสนอกำลังจะดาวน์โหลด โปรดรอ

1
สำนักงานวิจัยเพื่อการพัฒนา หลักประกันสุขภาพไทย Health Insurance System Research Office How to deal with data problems? By Ms. Alice Molinier (ILO) and Ms. Orawan Prasitsiriphon (HISRO)
 and Ms. Orawan Prasitsiriphon (HISRO).")
2
สำนักงานวิจัยเพื่อการพัฒนา หลักประกันสุขภาพไทย Health Insurance System Research Office Agenda Handling data problems Coffee Break Concrete examples

3
สำนักงานวิจัยเพื่อการพัฒนา หลักประกันสุขภาพไทย Health Insurance System Research Office Type of data problems Incorrect or inaccurate data –incomplete or incorrect recording of elementary data or incorrect aggregation data etc. Incomplete data –data on administrative costs are often not available. Missing data –the national health statistical system in question simply does not report a specific item which the modeler considers. Source: Cichon,1999,Modeling in health care financing

4
สำนักงานวิจัยเพื่อการพัฒนา หลักประกันสุขภาพไทย Health Insurance System Research Office Handling data problems Master data management.jpg

5
สำนักงานวิจัยเพื่อการพัฒนา หลักประกันสุขภาพไทย Health Insurance System Research Office Gathering data Some tips Plan it in advance! List all the data you will need and the institutions that you will need to contact In each institution you need at least two counterparts –1 decision maker –1 technician Be aware of the formal procedure Data are never perfect when you receive them on the first day! Explain why you need the data so that people do not have false expectations and are ready to share information “for free”. The minimum required data is to be mentioned in the letters; but a direct access to the databases is to be preferred when possible. Explain your assumptions and report your sources

6
สำนักงานวิจัยเพื่อการพัฒนา หลักประกันสุขภาพไทย Health Insurance System Research Office How to assess the quality of the data? Some tips Ask for non consolidated data (best: direct access to the database) Ask following questions: –a. How do they obtain the data? –b. How frequently do they actualize the database? –c. What are the updating processes of the databases? Try to cross check data Generate graphs (they help to visualize possible problems: frauds, inconsistencies,etc.) and try to find a logic in the data (if you cannot explain a phenomenon – there may be a problem) Compare data in the reports (official accounts) and the databases, and if there are differences try to understand why (e.g., non effective updating processes…) with an aim to get the “true picture”
 Ask following questions: –a. How do they obtain the data. –b. How frequently do they actualize the database. –c. What are the updating processes of the databases. Try to cross check data Generate graphs (they help to visualize possible problems: frauds, inconsistencies,etc.) and try to find a logic in the data (if you cannot explain a phenomenon – there may be a problem) Compare data in the reports (official accounts) and the databases, and if there are differences try to understand why (e.g., non effective updating processes…) with an aim to get the true picture .")
7
สำนักงานวิจัยเพื่อการพัฒนา หลักประกันสุขภาพไทย Health Insurance System Research Office How to assess the quality of data? PlausibilityReliability

8
สำนักงานวิจัยเพื่อการพัฒนา หลักประกันสุขภาพไทย Health Insurance System Research Office Filling data gaps. 1.Develop system to gather the data. 2.Gather a sample of the data. 3.Make assumptions to develop substitutes for the data. 4.Use proxy data from similar countries. Source: Cichon,1999,Modeling in health care financing

9
สำนักงานวิจัยเพื่อการพัฒนา หลักประกันสุขภาพไทย Health Insurance System Research Office Agenda Handling data problems Coffee Break Concrete examples –Incorrect or inaccurate data (cohort + problem of two data source for fertility rate) –Incomplete data (fertility rate) –Missing data (mortality rate)
 –Incomplete data (fertility rate) –Missing data (mortality rate)")
10
สำนักงานวิจัยเพื่อการพัฒนา หลักประกันสุขภาพไทย Health Insurance System Research Office Population projection The cohort component technique uses the components of demographic change to project population growth. The technique projects the population by age groups and sex.

11
สำนักงานวิจัยเพื่อการพัฒนา หลักประกันสุขภาพไทย Health Insurance System Research Office population projection The cohort component is based on the components of demographic change including births, deaths, and migration (assume net migration=0) Population t+1 = Population t + newborns t+1 – deaths t+1 + immigrants t+1 – emigrants t+1. 0 1 3 4 2 AgeTT+1T+2 Year

12
สำนักงานวิจัยเพื่อการพัฒนา หลักประกันสุขภาพไทย Health Insurance System Research Office 1. Incorrect or inaccurate data

13
สำนักงานวิจัยเพื่อการพัฒนา หลักประกันสุขภาพไทย Health Insurance System Research Office MALE POPULATION (single age, in thousands) Age200520062007200820092010 0379382364356349356 1391394422386370374 2437440436434430404 3435405433455428449 4454434413421442415 5482454450444454434 6452445444424411434 7529491482475452465 8593574520483 458 9578568536515495449 10625611629582529535 11559540559585520476 12618602613594609542 13602577582577568603 14646655622632646653 Source: The last census in 2000 from NSO
 Age Source: The last census in 2000 from NSO")
14
สำนักงานวิจัยเพื่อการพัฒนา หลักประกันสุขภาพไทย Health Insurance System Research Office MALE POPULATION (single age, in thousands) Age200520062007200820092010 0379382364356349356 1391394422386370374 2437440436434430404 3435405433455428449 4454434413421442415 5482454450444454434 6452445444424411434 7529491482475452465 8593574520483 458 9578568536515495449 10625611629582529535 11559540559585520476 12618602613594609542 13602577582577568603 14646655622632646653 Source: The last census in 2000 from NSO
 Age Source: The last census in 2000 from NSO")
15
สำนักงานวิจัยเพื่อการพัฒนา หลักประกันสุขภาพไทย Health Insurance System Research Office Pyramid Population

16
สำนักงานวิจัยเพื่อการพัฒนา หลักประกันสุขภาพไทย Health Insurance System Research Office How to deal? Accept / Reject plausibility and reliability Accept Have influences to model RAP model Reject Have any data which are more appropriate Limitation of data e.g. HWS: population by scheme Have any mathematics to adjust data Mean, Revised, Linear equation etc. Health model

17
สำนักงานวิจัยเพื่อการพัฒนา หลักประกันสุขภาพไทย Health Insurance System Research Office 2. Incomplete data

18
สำนักงานวิจัยเพื่อการพัฒนา หลักประกันสุขภาพไทย Health Insurance System Research Office Fertility rate Fertility rate is used to calculate number of newborns. These data is grouped by 5-year age group. (to protect fluctuate and abnormal data) Single age, It can be derived from the method of interpolations e.g. Sprague multipliers, Polynomial Interpolation, Karup-King third- difference formula etc.
 Single age, It can be derived from the method of interpolations e.g. Sprague multipliers, Polynomial Interpolation, Karup-King third- difference formula etc..")
19
สำนักงานวิจัยเพื่อการพัฒนา หลักประกันสุขภาพไทย Health Insurance System Research Office Example 2 Maternity Allowance for all informal working women in year 2008-2010. What do you do when you have two different source of information?

20
สำนักงานวิจัยเพื่อการพัฒนา หลักประกันสุขภาพไทย Health Insurance System Research Office Data and Information What do we have? –Fertility rate assumption of 2008-2010 –Number of population, employees in formal sector and economically active population by age and sex since 2008-2010 What do we want? –Number of newborns that would be born with women in informal workers in 2008-2010.

21
สำนักงานวิจัยเพื่อการพัฒนา หลักประกันสุขภาพไทย Health Insurance System Research Office

22
สำนักงานวิจัยเพื่อการพัฒนา หลักประกันสุขภาพไทย Health Insurance System Research Office Informal workers in 2006-2010 Source: NSO กลุ่มอายุ 25492550255125522553 Age Group20062007200820092010 Total9,87510,84911,10011,121 11,133 15 - 19360309283300 273 20 - 24601706743756 711 25 - 29796848897845 895 30 - 341,1461,1661,1881,136 1,080 35 - 391,3971,5181,4961,426 1,409 40 - 492,8623,0933,1473,172 3,228 50 - 591,8692,1562,2852,307 2,366 60 + 8451,0531,0601,179 1,171 In thousand

23
สำนักงานวิจัยเพื่อการพัฒนา หลักประกันสุขภาพไทย Health Insurance System Research Office How to calculate? Determine alternative between –Group fertility rate assumption data from age group 40-44 and 45-49 to 40-49 –Separate female informal worker data from age group 40-49 to 40-44 and 45-49 Calculate number of newborns who born with women in informal workers #Newborn=# of women in fertile age * fertility rate

24
สำนักงานวิจัยเพื่อการพัฒนา หลักประกันสุขภาพไทย Health Insurance System Research Office Group fertility rate assumption Age Group 2005- 2010 15-190.0098 20-240.0691 25-290.1243 30-340.0796 35-390.0308 40-440.0074 45-490.0008 TFR1.6090 Age Group 2005- 2010 15-190.0098 20-240.0691 25-290.1243 30-340.0796 35-390.0308 40-490.0082 TFR1.6090

25
สำนักงานวิจัยเพื่อการพัฒนา หลักประกันสุขภาพไทย Health Insurance System Research Office Separate female informal worker Assume proportion of total economically active population of age group 40-44 and 45-49 equal proportion of female informal workers in the same age groups.

26
สำนักงานวิจัยเพื่อการพัฒนา หลักประกันสุขภาพไทย Health Insurance System Research Office Separate female informal worker (2) Age 20062007200820092010 40-498,845.79,072.19,301.09,525.09,627.5 40-444,672.74,785.14,927.04,989.74,983.6 45-494,173.04,287.04,374.14,535.34,643.9 Proporti on 0.53:0.4 7 0.52:0.4 8 Total economically active population in thousand unit Age 20062007200820092010 40-492,861.823,093.313,147.473,172.223,227.90 40-441,511.761,631.561,667.291,661.771,670.89 45-491,350.061,461.751,480.191,510.451,557.01 Age20062007200820092010 40-498,845.79,072.19,301.09,525.09,627.5 40-444,672.74,785.14,927.04,989.74,983.6 45-494,173.04,287.04,374.14,535.34,643.9 Proporti on 0.53:0.4 7 0.52:0.4 8 Female informal workers in thousand unit
 Age ,845.79,072.19,301.09,525.09, ,672.74,785.14,927.04,989.74, ,173.04,287.04,374.14,535.34,643.9 Proporti on 0.53: :0.4 8 Total economically active population in thousand unit Age , , , , , , , , , , , , , , , Age ,845.79,072.19,301.09,525.09, ,672.74,785.14,927.04,989.74, ,173.04,287.04,374.14,535.34,643.9 Proporti on 0.53: :0.4 8 Female informal workers in thousand unit")
27
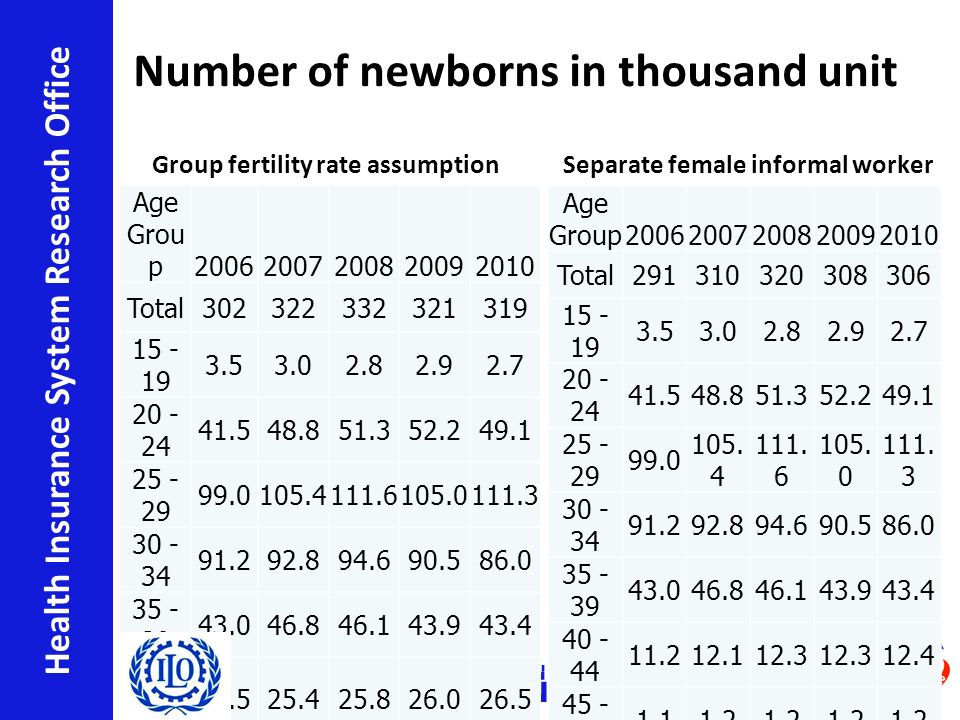
สำนักงานวิจัยเพื่อการพัฒนา หลักประกันสุขภาพไทย Health Insurance System Research Office Number of newborns in thousand unit Group fertility rate assumption Age Grou p 20062007200820092010 Total302322332321319 15 - 19 3.53.02.82.92.7 20 - 24 41.548.851.352.249.1 25 - 29 99.0105.4111.6105.0111.3 30 - 34 91.292.894.690.586.0 35 - 39 43.046.846.143.943.4 40 - 49 23.525.425.826.026.5 Separate female informal worker Age Group 20062007200820092010 Total291310320308306 15 - 19 3.53.02.82.92.7 20 - 24 41.548.851.352.249.1 25 - 29 99.0 105. 4 111. 6 105. 0 111. 3 30 - 34 91.292.894.690.586.0 35 - 39 43.046.846.143.943.4 40 - 44 11.212.112.3 12.4 45 - 49 1.11.2
28
สำนักงานวิจัยเพื่อการพัฒนา หลักประกันสุขภาพไทย Health Insurance System Research Office 3. Missing data

29
สำนักงานวิจัยเพื่อการพัฒนา หลักประกันสุขภาพไทย Health Insurance System Research Office Mortality pattern In Thailand, no standard mortality pattern. It has only mortality statistic and life expectancy. Use proxy data from similar countries by ‘West model’ mortality pattern then adjust by life expectancy in Thailand.

30
สำนักงานวิจัยเพื่อการพัฒนา หลักประกันสุขภาพไทย Health Insurance System Research Office

งานนำเสนอที่คล้ายกัน


 to solve a problem. How do we choose between them? At the heart of computer program.>")


 answers?.>")
