ดาวน์โหลดงานนำเสนอ
งานนำเสนอกำลังจะดาวน์โหลด โปรดรอ

1
การจำแนกข้อมูล(Classification) CART-Classification and regression Tree
อ.วิวัฒน์ ชินนาทศิริกุล

2
เทคนิค Classification and regression trees (CART) คิดค้น
โดย Breiman ในปืค.ศ.1984 ต้นไม้ตัดสินใจ ที่สร้างจากอัลกอริทึม CART จะเป็นต้นไม้ แบบ binary ซึ่งประกอบด้วย กิ่งหรือแขนง 2 กิ่ง สำหรับแต่ละ โหนด เทคนิคแบบ CART จะทำการแบ่ง เรคคอร์ดใน Training Data Set ออกเป็น เรคคอร์ดย่อย ที่ให้ค่าเป้าหมาย (target) ที่เหมือนกัน
 ที่เหมือนกัน.")
3
CART Algorithm กำหนด เป็นหน่วยวัดค่าที่ดีที่สุดของ การแตกโหนด
คู่แข่ง s ที่โหนด t โดยที่

4
- โหนดลูกทางซ้ายของโหนด t
จำนวนเรคคอร์ดที่โหนด tL จำนวนเรคคอร์ดใน Training Set จำนวนเรคคอร์ดที่โหนด tR จำนวนเรคคอร์ดใน Training Set จำนวนเรคคอร์ของคลาส j ที่ tL จำนวนเรคคอร์ที่ t จำนวนเรคคอร์ของคลาส j ที่ tR จำนวนเรคคอร์ที่ t

5
ตัวอย่าง จาก Training Data Set ที่กำหนดให้ดังตาราง จะสร้าง Decision
Tree ด้วย CART

6
ขั้นตอนการทำงาน นำแอททริบิวต์ Saving , Assets และ income มาสร้าง Candidate Split ดังตาราง

7
For each candidate split, let us examine the values of the various components of the optimality measure (s|t )
")
8
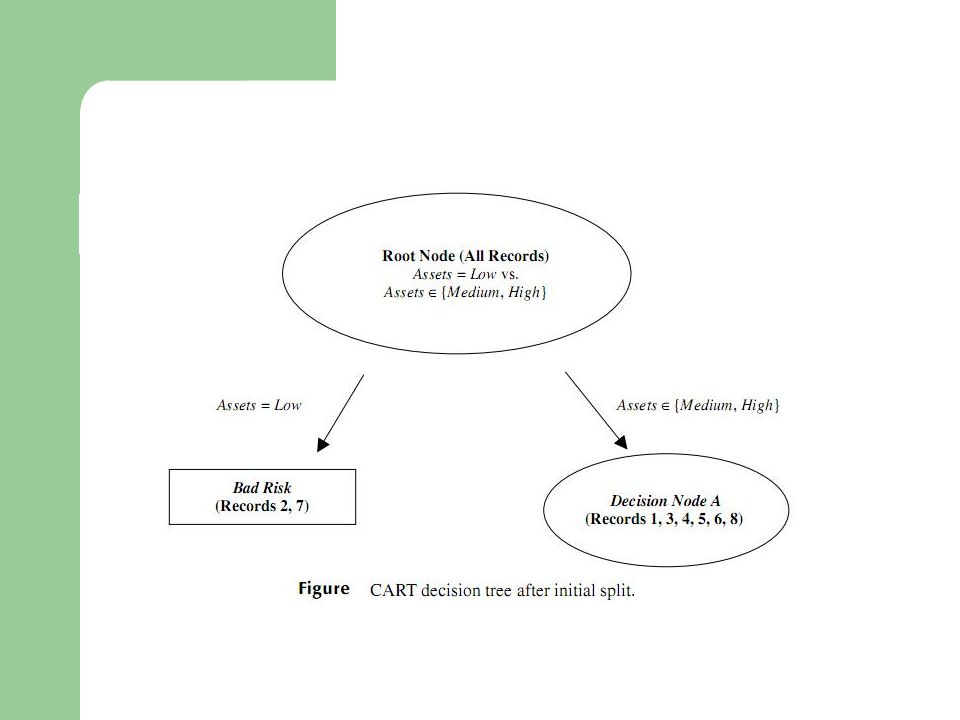
ใน Candidate Split รายการที่ 4 มีค่า มากที่สุดคือ 0.6248
The maximum observed value for (s|t ) among the candidate splits is therefore attained by split 4, with (s|t ) = CART therefore chooses to make the initial partition of the data set using candidate split 4, assets=low versus assets {medium , high} ใน Candidate Split รายการที่ 4 มีค่า มากที่สุดคือ ดังนั้นจะใช้ Candidate Split รายการที่ 4 คือ Assets=low และ Assets {medium , high} เป็น Root Node
 among the candidate. splits is therefore attained by split 4, with (s|t ) = CART therefore chooses to make the initial partition of the data set. using candidate split 4, assets=low versus assets {medium , high} ใน Candidate Split รายการที่ 4 มีค่า มากที่สุดคือ ดังนั้นจะใช้ Candidate Split รายการที่ 4 คือ Assets=low และ. Assets {medium , high} เป็น Root Node.")
10
ตารางแสดง Values of the Components of the Optimality Measure Φ(s |t )for
Each Candidate Split, for Decision Node A

11
Here two candidate splits (3 and 7) share the highest value for
Φ (s|t ), We arbitrarily select the first split encountered, split 3, savings = high versus savings {low, medium}, for decision node A
, We arbitrarily select the first split encountered, split 3, savings = high versus savings {low, medium}, for decision node A.")
12
ภาพแสดง CART decision tree after decision node A split.

13
แบบฝึกหัด จากข้อมูลที่กำหนดให้ ให้นักศึกษาใช้เทคนิค CART เพื่อจำแนกเงินเดือน (Salary) ข้อแนะนำ เนื่องจากตัวเลขอายุ และรายได้มีหลากลายเกินไป ควรจัดกลุ่มอายุ และรายได้ เช่น อายุ <30 ปี รายได้ < 35000 อายุ ปี <= รายได้ < 45000 อายุ >40 ปี <= รายได้ < 55000 รายได้ >55000

งานนำเสนอที่คล้ายกัน