ดาวน์โหลดงานนำเสนอ
งานนำเสนอกำลังจะดาวน์โหลด โปรดรอ

1
เอกสารเรียนวันที่ 22 กรกฎาคม 2554
การวางผัง

2
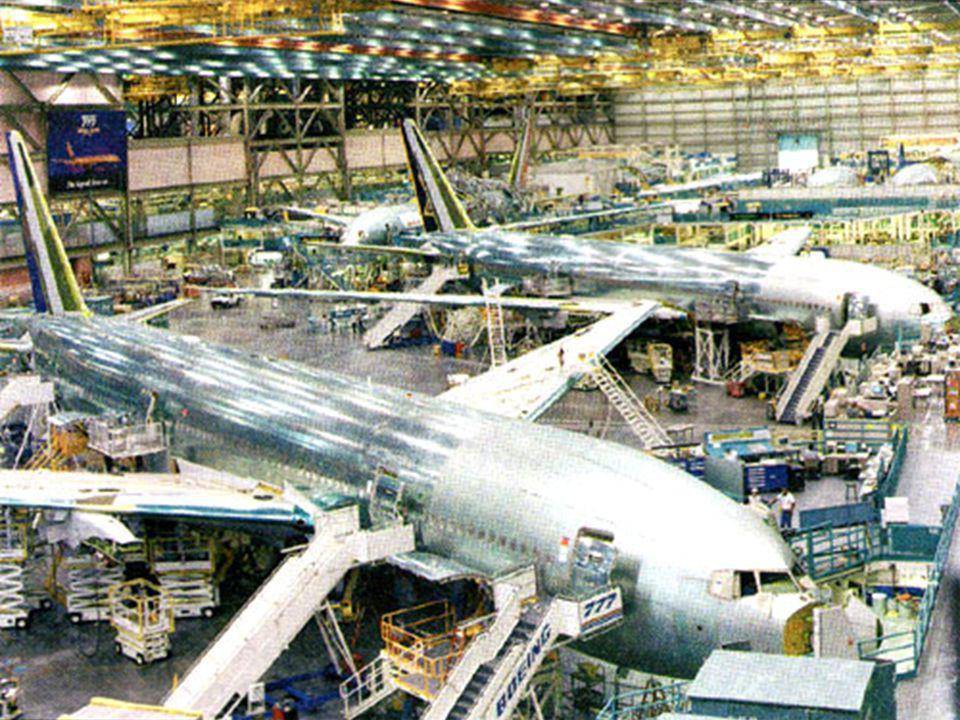
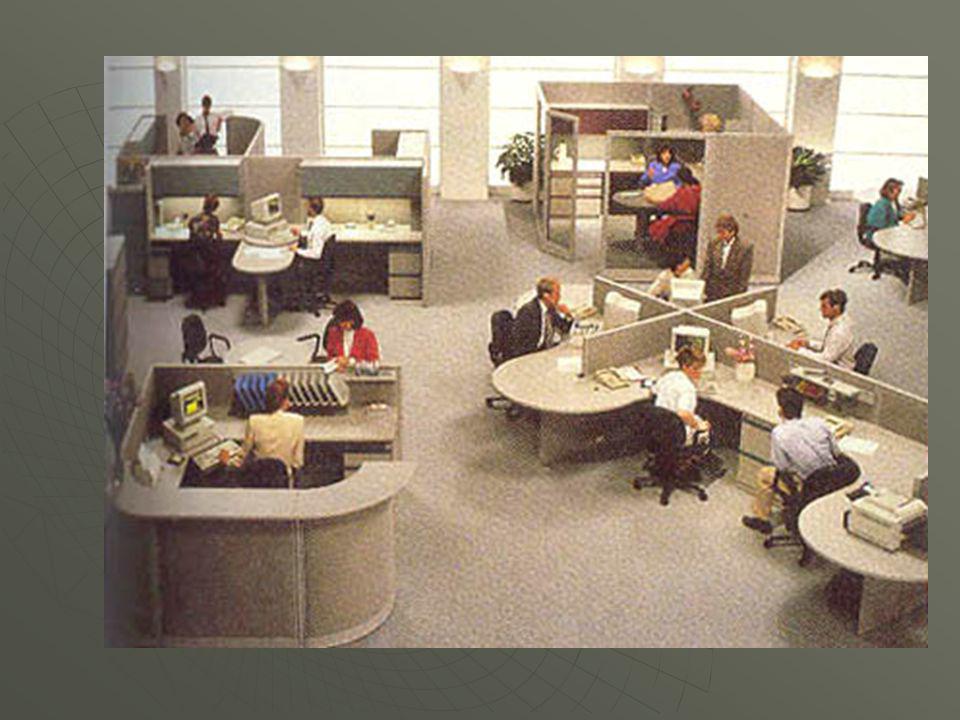
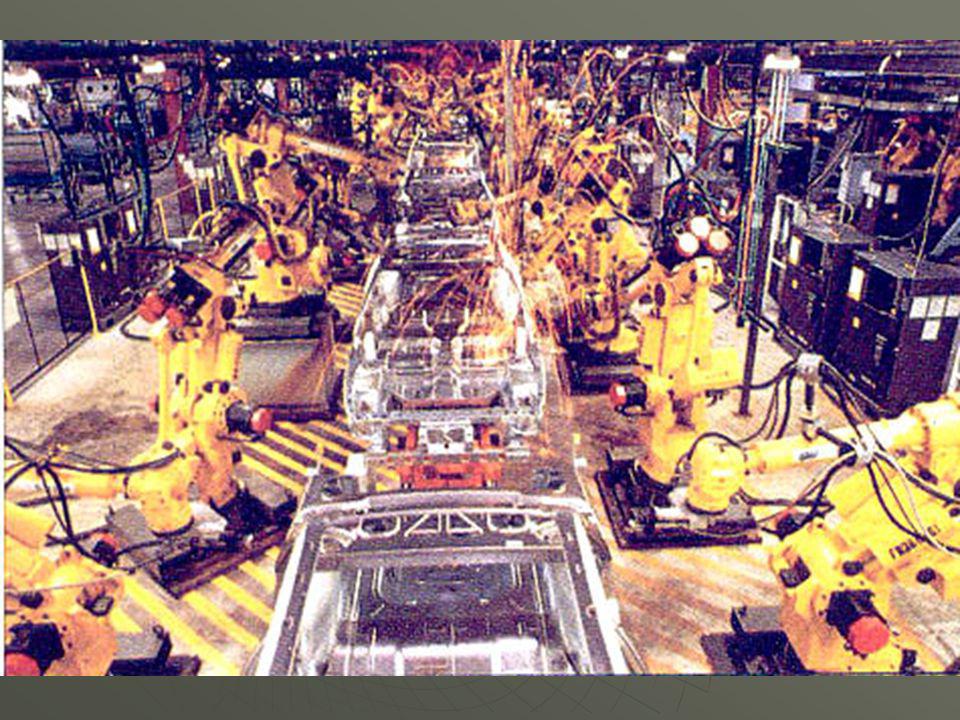
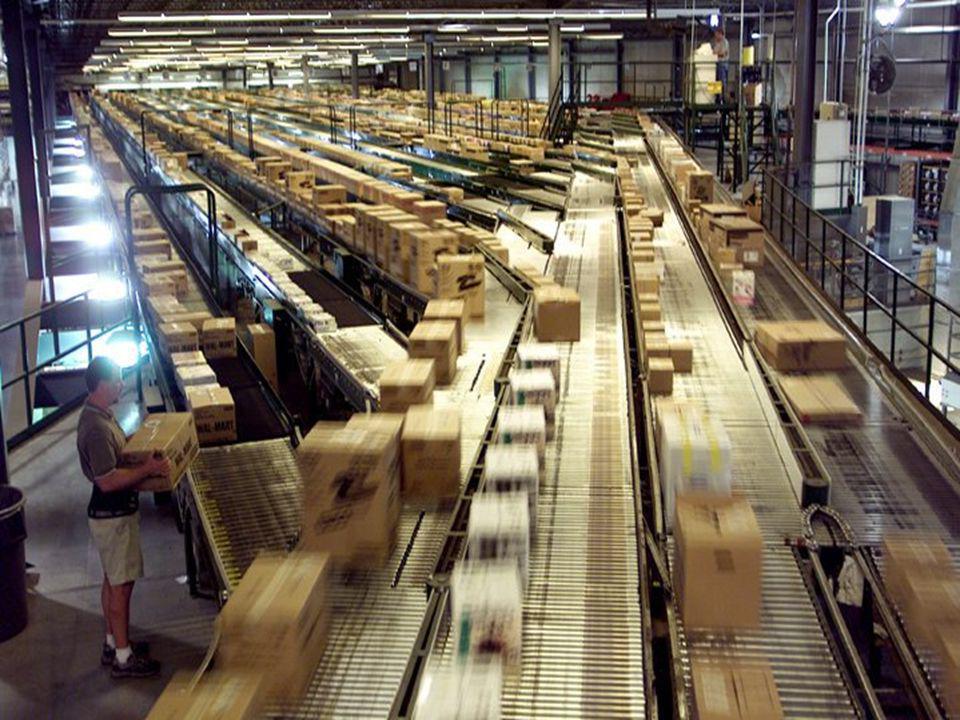
Facility Layout ประเด็นพิจารณาในการวางผัง การออกแบบผลิตภัณฑ์และปริมาณการผลิต เครื่องจักรอุปกรณ์ กระบวนการผลิต กำลังผลิต คุณภาพชีวิตในการทำงานและการติดต่อสื่อสาร ข้อจำกัดด้านตัวอาคาร ทำเลที่ตั้งและต้นทุนการเคลื่อนย้าย ชนิดของการวางผัง Fixed position layout Trade and Service layout Office layout Warehouse layout Process Layout Product layout

4
Service Process Layout
Women’s lingerie dresses sportswear Shoes Cosmetics & Jewelry Entry & display area House wares Children’s department Men’s

5
The ground floor plan of a department store showing the sports goods shop-within-a-shop retail ‘cell’ Sports shop Menswear Women’s clothes Luggage and gifts Confectionery, newspaper, magazines and stationery Books and videos Footwear Perfume & jewellery Elevators Entrance 9

6
แผนก ปริมาณเที่ยวในการขนย้าย พื้นที่ที่ต้องการ(หน่วย)
1.เครื่องปิ้งขนมปัง 2.เครื่องปรับอากาศ 3.ไมโครเวฟ 4.สเตริโอเครื่องเสียง 5.ทีวี 6.วิทยุ 7.เก็บสินค้าเทกอง

7
3 5 5 6 4 2 7 1 5 5 4 4 2 7 แผนก อัตราส่วนต่อพื้นที่ อันดับที่
แผนก อัตราส่วนต่อพื้นที่ อันดับที่ 1.เครื่องปิ้งขนมปัง 280/1 2 2.เครื่องปรับอากาศ 160/2 6 3.ไมโครเวฟ 360/1 1 4.สเตริโอเครื่องเสียง 375/3 5 5.ทีวี /4 3 6.วิทยุ /1 4 7.เก็บสินค้าเทกอง 100/2 7

8
Ranking System For Departments
A - absolutely necessary E - especially important I - important O - okay U - unimportant X - undesirable

10
Relationship Diagramming Example
Production O A Offices U I O Stockroom E A A X Shipping and Receiving U U U O O Locker Room O Tool room

11
A Product Layout IN OUT

14
Comparison Of Product And Process Layouts
PRODUCT LAYOUT PROCESS LAYOUT 1. Description Sequential arrangement Functional grouping of machines of machines 2. Type of Process Continuous, mass Intermittent, job shop production, mainly batch production, assembly mainly fabrication 3. Product Standardized Varied, made to stock made to order 4. Demand Stable Fluctuating 5. Volume High Low 6. Equipment Special purpose General purpose 7. Workers Limited skills Varied skills

15
Comparison Of Product And Process Layouts
PRODUCT LAYOUT PROCESS LAYOUT 8. Inventory Low in-process, High in-process, high finished goods low finished goods 9. Storage space Small Large 10. Material Fixed path Variable path handling (conveyor) (forklift) 11. Aisles Narrow Wide 12. Scheduling Part of balancing Dynamic 13. Layout decision Line balancing Machine location 14. Goal Equalize work at Minimize material each station handling cost 15. Advantage Efficiency Flexibility
 (forklift) 11. Aisles Narrow Wide. 12. Scheduling Part of balancing Dynamic. 13. Layout decision Line balancing Machine location. 14. Goal Equalize work at Minimize material. each station handling cost. 15. Advantage Efficiency Flexibility.")
16
Designing Process Layouts
Minimize material handling costs Block Diagramming minimize nonadjacent loads use when quantitative data is available Relationship Diagramming based on location preference between areas use when quantitative data is not available

18
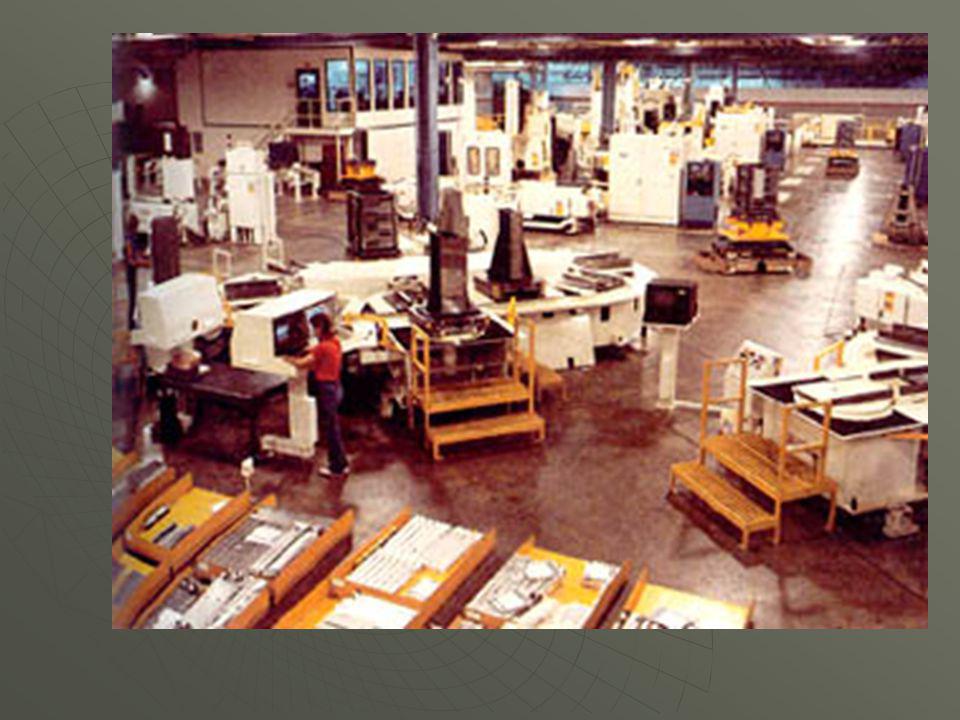
Manufacturing Process Layout
Milling Department Lathe Department Drilling Department L L M M D D D D M M D D D D L L L L G G G P G G G P L L Grinding Department Painting Department L L A A A Receiving and Shipping Assembly

19
Block Diagramming Create load summary chart
Calculate composite (two way) movements Develop trial layouts minimizing number of nonadjacent loads
 movements. Develop trial layouts minimizing number of nonadjacent loads.")
20
Block Diagramming Example
LOAD SUMMARY CHART DEPARTMENT DEPT. 1 2 3 4 5 1 100 50 2 200 50 3 60 40 50 4 100 5 50 60

21
Initial & Final Designs

22
Block Diagrams

23
Relationship Diagramming
Used when quantitative data is not available Muther’s grid displays preferences Denote location preferences with weighted lines

24
Service Layouts Usually process layouts due to customers needs
Minimize flow of customers or paperwork Retailing tries to maximize customer exposure to products Computer programs consider shelf space, demand, profitability Layouts must be aesthetically pleasing

25
Designing Product Layouts
Product layouts or assembly lines Develop precedence diagram of tasks Jobs divided into work elements Assign work elements to workstations Try to balance the amount work of each workstation

26
Line Balancing Precedence diagram Cycle time
network showing order of tasks and restrictions on their performance Cycle time maximum time product spends at any one workstation

27
Flow Time vs Cycle Time Flow time = time to complete all stations
Cycle time = max time spent at any station 1 2 3 4 min 5 min Flow time = = 13 Cycle time = max (4, 5, 4) = 5
 = 5.")
28
Drawing A Precedence Example
Work element Precedence time A Press out sheet of fruit - 0.1 B Cut into strips A 0.2 C Outline fun shapes A 0.4 D Roll up and package B, C 0.3 0.2 B 0.1 A D 0.3 C 0.4

29
Computing Cycle Time C = maximum time product spends at station
Produce 6,000 units per 40 hour week

30
Balancing The Line Workstation Task Remaining time Feasible tasks
1 A B B none 2 C none 3 D 1 2 3 0.3 min 0.4 min A, B C D

31
Calculating Efficiency

32
Trial & Error Method of Line Balancing
1. Draw & label precedence diagram 2. Calculate required cycle time 3. Calculate theoretical minimum number of workstations 4. Group elements into workstations using cycle time & precedence constraints 5. Calculate efficiency 6. Stop if theoretical minimum number of workstations or acceptable efficiency level reached If not, go back to step 4

33
Computerized Line Balancing
Use heuristics to assign tasks to workstations longest operation time shortest operation time most number of following tasks least number of following tasks

34
D 40 สวมมอเตอร์กับแกนหมุน C E 40 ประกอบขาตั้ง B,D
งานย่อย ใช้เวลา คำบรรยายลักษณะงาน ลำดับงาน A ประกอบแผงสวิชท์ - B ประกอบฝาครอบ A C พันมอเตอร์ - D สวมมอเตอร์กับแกนหมุน C E ประกอบขาตั้ง B,D F เช็คทำความสะอาด - G ประกอบโครงฝา F H ประกอบใบพัด D,G I ปิดฝาครอบ E,H รวม 500

35
A B C

36
ลำดับที่ สถานีที่ งานที่จัดให้ งานเลือก เวลาที่ใช้ เวลาเหลือ งานที่ยังจัดได้
1 1 A C F A C B F 2 1 C B F B C F 3 1 C F C 4 2 D F F D G 5 2 D G G 6 3 D D E H 7 3 E H H E 8 3 E E I 9 3 I I

37
มอบหมายงานต่อ ให้ไปค้นคว้าและทำ Dummy ต่อ ในหัวข้อต่อไปนี้
การพยากรณ์ กรอบของเวลา ชนิดของการพยากรณ์ ดีมานด์เป็นอย่างไร กำลังการผลิต กำหนดอย่างไร ใช้เกณฑ์อะไร ทำเลที่ตั้ง พิจารณาปัจจัยอะไร ใช้เครื่องมืออะไรในการเลือก การวางผัง เลือกชนิดไหน เพราะอะไร ส่งภายในวันที่ 27 กรกฎาคม 2554 ก่อนเที่ยงที่ภาควิชาการจัดการ

งานนำเสนอที่คล้ายกัน
 ในช่วงยุค Internet เพิ่ง เริ่มต้น เป็นบริษัทที่ดำเนินงานทางด้าน.>")

 2007 Pearson Education, Inc. All rights reserved. 0-13-222158-61 Java Programming Language.>")

![คำสั่ง DISPLAY รูปแบบที่ 1 DISPLAY identifier-1, identifier-2 … literal-1 literal-2 [ UPON mnemonic-name ] ตัวอย่าง DISPLAY STUDENT-NAME. DISPLAY.](/7/1925791/big_thumb.jpg "คำสั่ง DISPLAY รูปแบบที่ 1 DISPLAY identifier-1, identifier-2 … literal-1 literal-2 [ UPON mnemonic-name ] ตัวอย่าง DISPLAY STUDENT-NAME. DISPLAY.>")


