ดาวน์โหลดงานนำเสนอ
งานนำเสนอกำลังจะดาวน์โหลด โปรดรอ

2
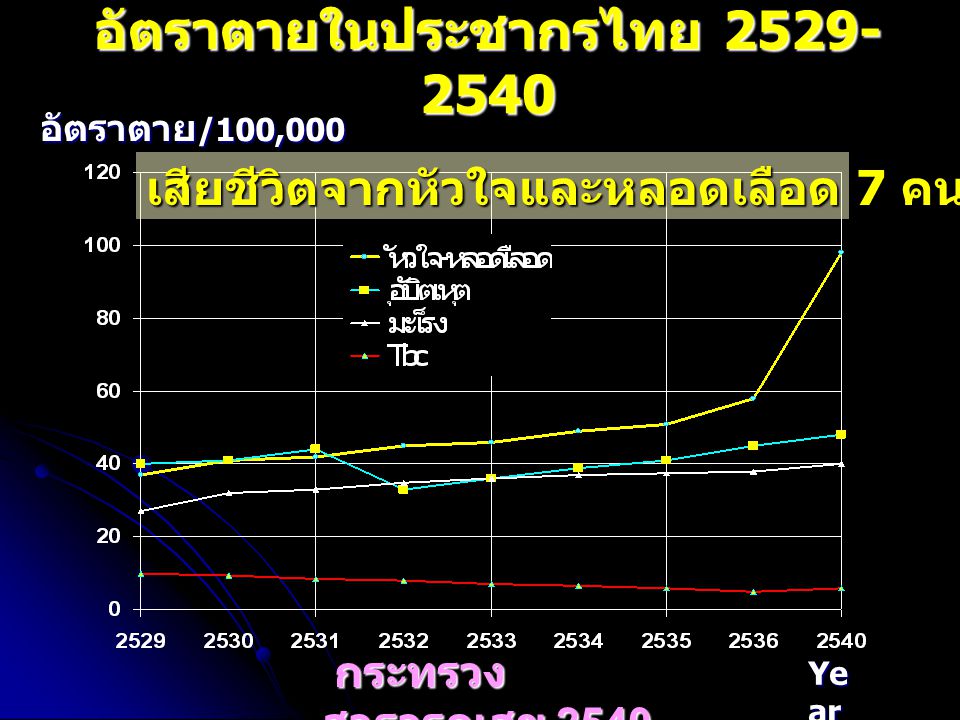
อัตราตายในประชากรไทย 2529- 2540 อัตราตาย /100,000 Ye ar กระทรวง สาธารณสุข 2540 กระทรวง สาธารณสุข 2540 เสียชีวิตจากหัวใจและหลอดเลือด 7 คน / ชั่วโมง

4
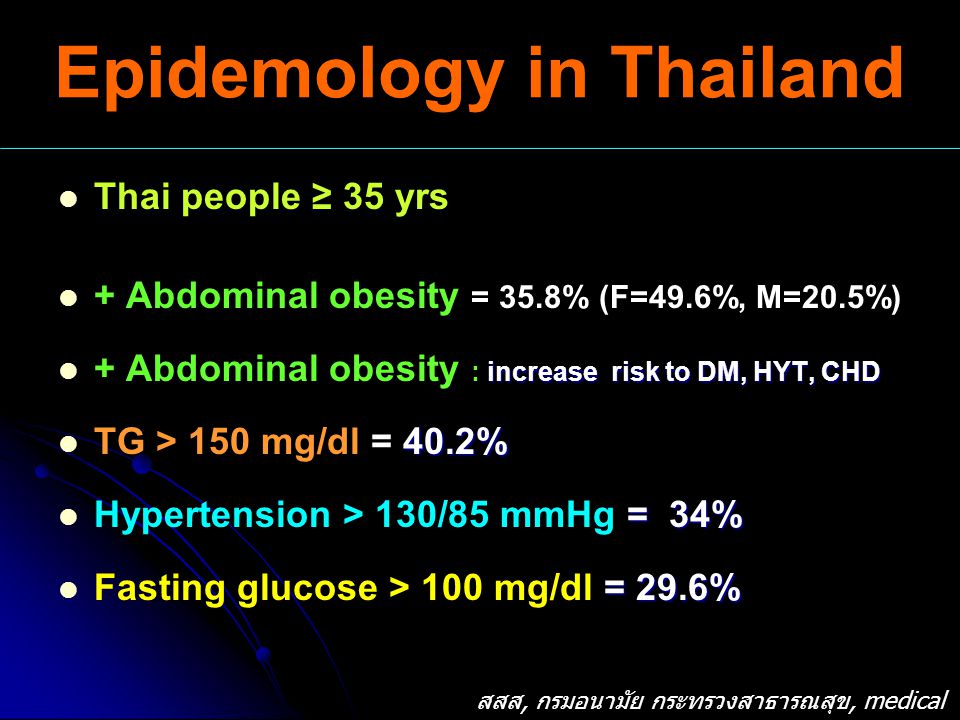
Epidemology in Thailand Thai people ≥ 35 yrs + Abdominal obesity = 35.8% (F=49.6%, M=20.5%) increase risk to DM, HYT, CHD + Abdominal obesity : increase risk to DM, HYT, CHD 40.2% TG > 150 mg/dl = 40.2% = 34% Hypertension > 130/85 mmHg = 34% = 29.6% Fasting glucose > 100 mg/dl = 29.6% สสส, กรมอนามัย กระทรวงสาธารณสุข, medical new 1-15/8/2549
 increase risk to DM, HYT, CHD + Abdominal obesity : increase risk to DM, HYT, CHD 40.2% TG > 150 mg/dl = 40.2% = 34% Hypertension > 130/85 mmHg = 34% = 29.6% Fasting glucose > 100 mg/dl = 29.6% สสส, กรมอนามัย กระทรวงสาธารณสุข, medical new 1-15/8/2549")
5
THE ASIAN DISEASE : Diabetes is becoming a regional epidemic. Are you or kids-at risk?

6
เบาหวานคืออะไร ? อาหารที่รับประทานเข้าไปส่วนใหญ่จะเปลี่ยนเป็นน้ำตาลกลูโคสในกระแสเลือด เพื่อใช้เป็นพลังงาน และเซลล์ในตับอ่อน ชื่อ เบต้าเซลล์เป็นตัวสร้างอินซูลิน และ อินซูลินจะเป็นตัวนำน้ำตาลเข้าเซลล์เพื่อใช้เป็นพลังงาน โรคเบาหวาน คือ ภาวะที่ร่างกายมีระดับน้ำตาลในเลือดสูงกว่าปกติ เกิดเนื่องจาก การขาดฮอร์โมนอินซูลินหรือดื้อต่ออินซูลิน

7
1.Symptoms of diabetes and a casual plasma glucose 200 mg/dl (11.1 mmol/l) OR 2. Fasting plasma glucose : FPG 126 mg/dl (การวัดระดับกลูโคสในพลาสมาหลังการอดอาหารอย่างน้อย 8 ช.ม) OR 3. 2-h plasma glucose 200 mg/dl during an OGTT (การวัดความทนน้ำตาลกลูโคส). The test should be performed as described by the World Health Organization, using a glucose load containing the equivalent of 75-g anhydrous glucose dissolved in water. Diagnostic Criteria for Diabetes
 OR 3. 2-h plasma glucose 200 mg/dl during an OGTT (การวัดความทนน้ำตาลกลูโคส). The test should be performed as described by the World Health Organization, using a glucose load containing the equivalent of 75-g anhydrous glucose dissolved in water. Diagnostic Criteria for Diabetes.")
8
24-Hour Plasma Glucose Curve Normal and Type 2 Diabetic Subjects Adapted from Polonsky et al, N Engl J Med 1988. Time of Day 400 300 200 100 0 0600 100022000200 Glucose (mg/dL) Normal Meal Diabetic 2-h PPG 140 2-h PPG 14001800
 Normal Meal Diabetic 2-h PPG h PPG")
9
Type of Diabetes 1.Type 1 Diabetes 2.Type 2 Diabetes 3. Gestational diabetes

10
Type of Diabetes เบาหวานชนิดที่หนึ่งเบาหวานชนิดที่สอง เกิดในเด็ก,คนอายุน้อย< 30 ผอม ไม่สามารถสร้างอินซูลิน จำเป็นต้องใช้อินซูลิน เกิดในคนอายุมาก (35- 40) น้ำหนักเกินหรืออ้วน ผลิตอินซูลินได้บ้าง แต่ไม่พอ คุมอาหาร ใช้ยาเม็ดและอินซูลิน
 น้ำหนักเกินหรืออ้วน ผลิตอินซูลินได้บ้าง แต่ไม่พอ คุมอาหาร ใช้ยาเม็ดและอินซูลิน")
11
Type 2 Diabetes มีประวัติของการเป็นเบาหวานระหว่างตั้งครรภ์ มีภาวะของ impaired glucose tolerance คนที่เป็นเบาหวาน 90 % เป็นเบาหวานชนิดที่ 2 อาการเหมือนกับเบาหวานชนิดที่ 1 เกิดหลังจากอายุ 30 – 40 ปี อ้วน Obesity มีประวัติครอบครัวเป็นเบาหวาน

12
Gestational diabetes Geatational diabetes เป็นการเกิดโรคเบาหวานแบบ ชั่วคราว ซึ่งพบในกลุ่มของตั้งครรภ์ และ อาการก็จะหายไปเองหลังจากคลอด “ รักษาโดยการ diet และการใช้ insulin ” risk : มีโอกาสในการพัฒนาเป็น impaired glucose (IGT ) หรือ type 2 diabetes.
 หรือ type 2 diabetes.")
13
Normal < 100 < 140 IFG 100 < 126 IGT 140 < 200 DM > 126 > 200** Fasting Plasma Glucose (FPG) (mg/dL) Random Plasma Glucose (mg/dL)** * Testing must be repeated on separate day. FPG is the preferred test ** Symptoms of DM IFG = Impaired fasting glucose IGT = Impaired glucose tolerance Criteria for Diagnosis of DM Stage ADA.2004

14
Normal < 100 < 140 IFG 110 < 126 IGT 140 < 200 DM > 126 > 200** Fasting Plasma Glucose (FPG) (mg/dL) Random Plasma Glucose (mg/dL)** * Testing must be repeated on separate day. FPG is the preferred test ** Symptoms of DM IFG = Impaired fasting glucose IGT = Impaired glucose tolerance Criteria for Diagnosis of DM Stage Pre-Diabetes ADA.2004

15
Prevalence of Diabetes in Thailand (population aged ≥35 yrs) Percent Data provided by Wichai Aekplakorn IFG 5.9%
 Percent Data provided by Wichai Aekplakorn IFG 5.9%")
16
Prevalence of Diabetes in Thai Adults Aekplakorn W. Diabetes Care 2003; 26: 2758-63 0 2 4 6 8 10 12 14 16 18 35-4445-5455-64 >65 Overall Total DM Known DM IFG P e r c e n t A g e The Burden of Diabetes in Thailand Rising prevalence of diabetes in Thailand ( age > 35 year ) from 5.7% (1991) to 9.6% ( 2000 )
 from 5.7% (1991) to 9.6% ( 2000 ).")
17
เป้าหมายในการรักษาโรคเบาหวาน 1. ควบคุมระดับน้ำตาลในเลือดให้ใกล้เคียงปกติ 2. ป้องกันโรคแทรกซ้อนเฉียบพลัน และเรื้อรัง 3. มีการดำรงชีวิตที่ปกติเหมือนคนทั่วไป 4. มีการเจริญเติบโตปกติ

18
Seven-year incidence in a Finnish-based cohort. *P < 0.001 Risk of MI is increased in type 2 diabetes 3.5% 20.2% 18.8% 45.0% 0% 10% 20% 30% 40% 50% Non-diabetic subjects (n = 1373) Type 2 diabetic subjects (n = 1059) Risk of fatal or nonfatal MI No prior MI Prior MI * * Adapted from Haffner SM. New Engl J Med 1998; 339: 229 – 34. Type 2 Diabetes is a CHD Risk Factor Diabetes and Prior MI Predict Mortality Equally
 Type 2 diabetic subjects (n = 1059) Risk of fatal or nonfatal MI No prior MI Prior MI * * Adapted from Haffner SM. New Engl J Med 1998; 339: 229 – 34. Type 2 Diabetes is a CHD Risk Factor Diabetes and Prior MI Predict Mortality Equally.")
19
Hyperglycemia/ Hypoglycemia Microvascular –Retinopathy:Glaucoma and cataracts –Nephropathy –Neuropathy Macrovascular -Myocardial infarction (MI) -Cerbrovascular accident(CVA): stroke, TIA -Periperal vascular disease Increase risk of infection Complications of Diabetes
 -Cerbrovascular accident(CVA): stroke, TIA -Periperal vascular disease Increase risk of infection Complications of Diabetes")
20
UKPDS=United Kingdom Prospective Diabetes Study; HOMA=homeostasis model assessment. Adapted from Holman RR. Diabetes Res Clin Pract. 1998;40(suppl):S21-S25. U.K. Prospective Diabetes Study Group. Diabetes. 1995;44:1249-1258. Decline of -Cell Function in the UKPDS Illustrates Progressive Nature of Diabetes -Cell function (% of normal by HOMA) Time (y) 0 20 40 60 80 100 –10–9–9–8–8–7–7–6–6–5–5–4–4–3–3–2–2–1–10123456 Time of diagnosis ? Pancreatic function = 50% of normal
:S21-S25. U.K. Prospective Diabetes Study Group. Diabetes. 1995;44: Decline of -Cell Function in the UKPDS Illustrates Progressive Nature of Diabetes -Cell function (% of normal by HOMA) Time (y) –10–9–9–8–8–7–7–6–6–5–5–4–4–3–3–2–2–1– Time of diagnosis . Pancreatic function = 50% of normal.")
22
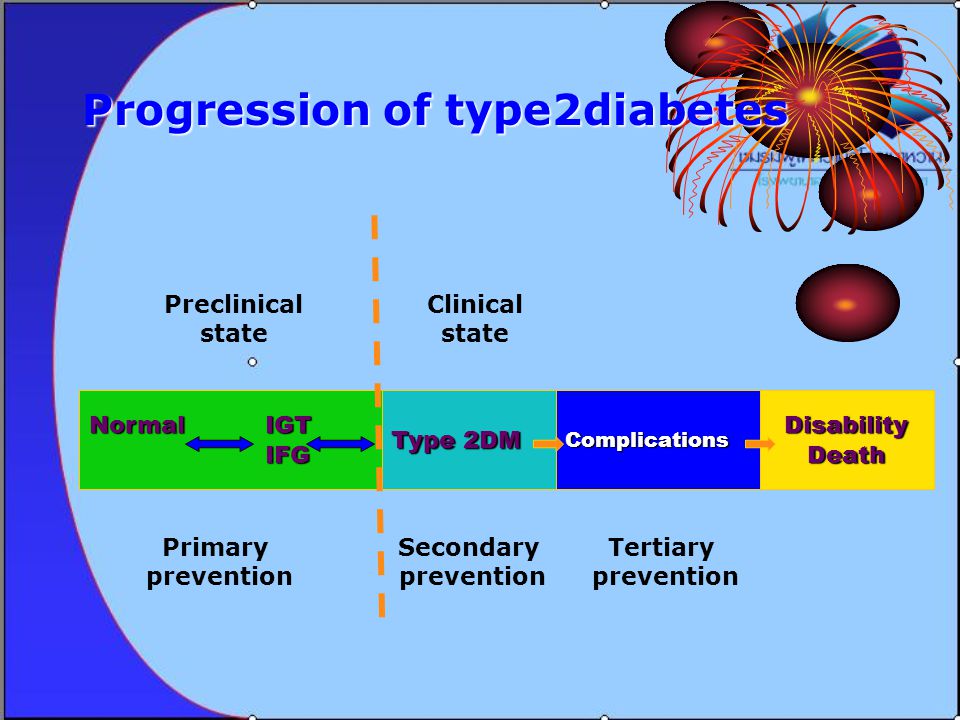
Normal IGT IFG IFG Progression of type2diabetes Type 2DM ComplicationsDisabilityDeath Preclinical state Clinical state Primary prevention Secondary prevention Tertiary prevention

23
Diabetes Registry Project

24
Diabetes Registry Project 2003 The Endocrine Society of Thailand CRF Data entry interface

25
Diabetes Registry Project 2003 The Endocrine Society of Thailand สถานภาพทางเศรษฐกิจและสังคม

26
Diabetes Registry Project 2003 The Endocrine Society of Thailand การติดตามปัจจัยเสี่ยงและประเมิน ภาวะแทรกซ้อน

27
Diabetes Registry Project 2003 The Endocrine Society of Thailand การใช้ยาในผู้ป่วยเบาหวาน

28
Diabetes Registry Project 2003 The Endocrine Society of Thailand Number 0f Subject institute institutenumber Chulalongkorn1110 RAMA843 Siriraj621 Vajira997 Phra Mongkutklao956 Theptarin964 Rajavidhi1412 Chiangmai675 Khonkaen250 Songkhla525 Nakorn Rajsima1066 N = 9,419 (expected sample size = 8360 cases)
")
29
Diabetes Registry Project 2003 The Endocrine Society of Thailand Results N= 9,419 Type2 94.6% Uncertain 0.4% Other 0.5% Type1 4.5% F = 65.9% M= 34.1% 6 cases of MODY Mean age 59.4 ± 13.5 years Mean duration 10 ± 7.6 years

30
Diabetes Registry Project 2003 The Endocrine Society of Thailand Achievement of Control percentag e 37.2% 63.3% 32.2% 43.8% 5% 69.3% 61.8% 0 20 40 60 80 100 FPG > 130HbA1C > 7Cr >2T_Chol > 200 HDL<40LDL>100TG > 150 1.2± 0.9 154± 56 114 ±36 8.2± 1.9 197± 42.5 54± 15 151 ± 105

31
Diabetes Registry Project 2003 The Endocrine Society of Thailand Achievement of DM Control by HbA1c 7- 8% >8% <7 %30.7% 25.8% 43.5% N = 9,092

32
Diabetes Registry Project 2003 The Endocrine Society of Thailand Co-morbidity in The Metabolic Syndrome 63.3 % 73.3%

33
Diabetes Complication in the Thailand Diabetes Registry N = 9,419

34
Diabetes Registry Project 2003 The Endocrine Society of Thailand Nephropathy No UMA Proteinuria Renal Impairment N=5,145 NA= 4274/9419 (45.4%) No 56.1 % Prot. 17.8 % UMA 17.8 % RI 8.3 % 43.9%

35
Diabetes Registry Project 2003 The Endocrine Society of Thailand Retinopathy No NPDR PDR PDR 9.4 % NDPR 21.3 % No 69.3% NA 2,300/9,41 9 (24.4%) Blindness from DM 118/8,128 (1.5 %) N= 7,119 31.4 %
 Blindness from DM 118/8,128 (1.5 %) N= 7, %")
38
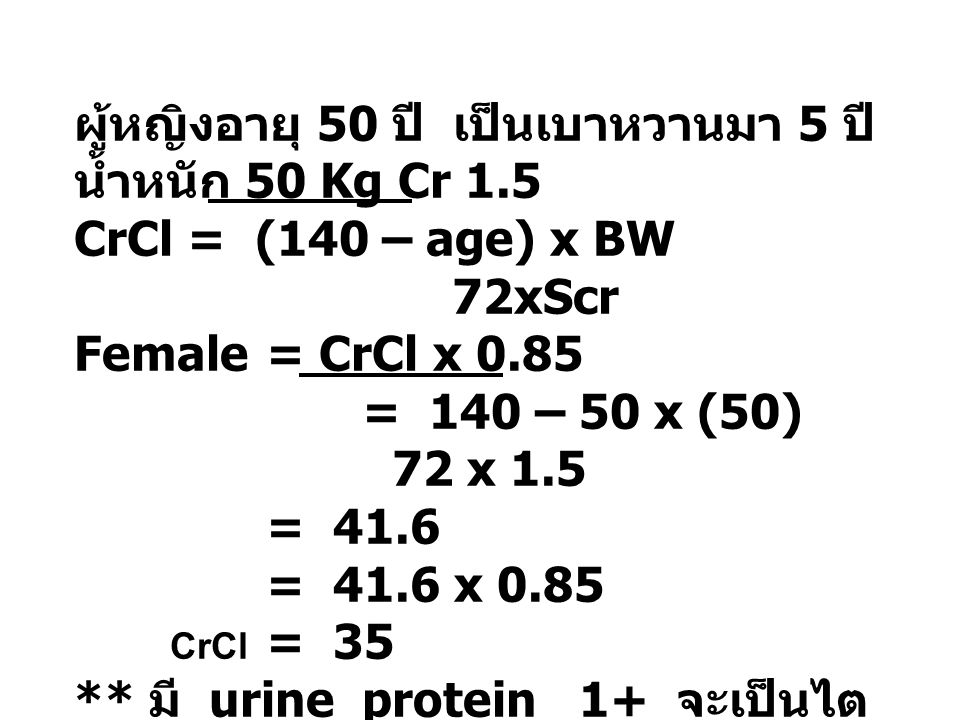
ผู้หญิงอายุ 50 ปี เป็นเบาหวานมา 5 ปี น้ำหนัก 50 Kg Cr 1.5 CrCl = (140 – age) x BW 72xScr Female = CrCl x 0.85 = 140 – 50 x (50) 72 x 1.5 = 41.6 = 41.6 x 0.85 CrCl = 35 ** มี urine protein 1+ จะเป็นไต วายในเวลากี่ปี
 x BW 72xScr Female = CrCl x 0.85 = 140 – 50 x (50) 72 x 1.5 = 41.6 = 41.6 x 0.85 CrCl = 35 ** มี urine protein 1+ จะเป็นไต วายในเวลากี่ปี")
39
Frequency of complication measured: community hospital Low A1 checked Nitiyanant J Med Assoc Thai 2007;90; 65-71

40
Outpatients with type 2 DM in Maharat NakhonRatchasima Hospital Target ADA/EASD for DM management 0 10 20 30 40 50 60 70 80 SBP<130 mmHg DBP<80 mmHg FBS<130 mg/dl HbA1c< 7% TChol<200 mg/dl TG<150 mg/dl HDL > 40 in male >50 in female LDL<100 mg/dl percentages DM 2003DM 2008

41
0 1,000 2,000 3,000 4,000 5,000 6,000 No complications Micro- vascular Macro- vascular Both micro and macro Total costs (€) Costs due to hospitalization (%) Williams R, et al. Diabetologia 2002; 45:S13–S17. 1,505 2,563 3,148 5,226 38% 46% 56% 60% 70% 109% 247% Complication costs driven by hospitalization Increase in costs vs. no complications CODE-2: effect of complications on costs Cost (€)
.")
42
1 Huse DM, et al. JAMA 1989; 262:2708–2713. 2 Ray NF, et al. ADA, 1993. 3 ADA. Diabetes Care 1998; 21:296–309. 4 ADA. Diabetes Care 2003; 26:917–932. Estimated US costs Year Cost per year (US$ billion) 0 20 40 60 80 100 120 1986 1 1992 2 1997 3 $98 $92 $20 2002 4 $132 140 Diabetes: the cost to society Indirect costs Direct costs Direct costs breakdown 4 Hospital inpatient care Nursing home care Physician office visits Insulin and supplies Non-diabetic outpatient medication 44% 15% 11% 8% 5% 6% Oral anti-diabetic agents Cost of diabetes care in Thailand IPD 2546-47: 41,950 – 42,921 b/case 11,827.2 mBaht/year 2548: 11,828 b/case 3,259.3 mBaht/year (MOPH) OPD 2546: 9,033 baht/case 11,200,9 mBaht/year
 $98 $92 $ $ Diabetes: the cost to society Indirect costs Direct costs Direct costs breakdown 4 Hospital inpatient care Nursing home care Physician office visits Insulin and supplies Non-diabetic outpatient medication 44% 15% 11% 8% 5% 6% Oral anti-diabetic agents Cost of diabetes care in Thailand IPD : 41,950 – 42,921 b/case 11,827.2 mBaht/year 2548: 11,828 b/case 3,259.3 mBaht/year (MOPH) OPD 2546: 9,033 baht/case 11,200,9 mBaht/year.")
43
Combination of Risk Factors Increases Risk of MI: PROCAM Assmann G, Schulte H. Am Heart J 1988;116:1713–1724. 0 20 40 60 80 100 120 Incidence of MI/1000 pts Prevalence (%): 54.9 22.9 2.6 2.3 9.4 8.0 None Hypertension only Diabetes only Hypertension and diabetes Dyslipidaemia only Dyslipidaemia+hypertension +/-diabetes
: None Hypertension only Diabetes only Hypertension and diabetes Dyslipidaemia only Dyslipidaemia+hypertension +/-diabetes.")
44
Staged Diabetes Management DiabetesDiabetes HyperglycemiaHyperglycemia Lipid Disorders HypertensionHypertensionMicrovascularComplicationsMicrovascularComplicationsOtherComponents of Care OtherComponents

45
Assaults on the Vascular Bed in Diabetes DiabetesDiabetes HyperglycemiaHyperglycemia Lipid Disorders HypertensionHypertensionMicrovascularComplicationsMicrovascularComplicationsOtherComponents of Care OtherComponents Vascular Bed

46
Targets in Type 2 DM HbA1c < 7% LDL-C < 100 mg/dl HDL-C > 40 mg/dl Triglyceride < 150 mg/dl BP < 130/80 mmHg Outcome Worse Outcome Better Cost Lower Cost Higher No!

47
Diabetes Control and Complicaion Trial(DCCT) total of 1441 patients with IDDM,mean follow up 6.5 years intensive therapy: external insulin pump or by three or more daily insulin injections and guided by frequent blood glucose monitoring conventional therapy with one or two daily insulin injection Endpoint: The patients were ed for a, and the appearance and progression of retinopathy and other complications were assessed regularly. Results In the intensive therapy vs conventional therapy. : primary-prevention: reduce risk of development of retinopathy by 76 % : secondary-intervention: progression of retinopathy 54 % : reduced microalbuminuria 39 % : reduced neuropathy by 60 % The chief adverse event associated with intensive therapy was a two-to-threefold increase in severe hypoglycemia. Conclusions Intensive therapy effectively delays the onset and slows the progression of diabetic retinopathy, nephropathy, and neuropathy in patients with IDDM. NEJM: Volume 329:977-986 September 30, Number 14 1993September 30, 1993

48
Adapted from Stratton IM, et al. UKPDS 35. BMJ 2000; 321:405–412. UKPDS: decreased risk of diabetes-related complications associated with a 1% decrease in A1C Percentage increase in relative risk corresponding to a 1% rise in HbA1C ** Any diabetes- related endpoint 21% ** Diabetes- related death 21%** All cause mortality 14% * Stroke 12% ** Peripheral vascular disease † 43% ** Myocardial infarction 14% ** Micro- vascular disease 37% ** Cataract extraction 19% Observational analysis from UKPDS study data † Lower extremity amputation or fatal peripheral vascular disease *P = 0.035; **P < 0.0001 1% reduction in A1C would reduce the risk of microvascular complications by 37%, but have less effect (14%) on macrovascular complications
 on macrovascular complications.")
49
DCCT Research Group. N Engl J Med. 1993;329:977-986. Ohkubo Y, et al. Diabetes Res Clin Pract. 1995;28:103-117. UKPDS 33: Lancet 1998; 352, 837-853. Glycemic Control - Intervention Studies Micro and Macrovascular Complications Reduction in risk with intensive therapy RetinopathyNephropathyNeuropathy Cardiovascular disease DCCT (Type 1) 63%54%60%41%*(p=0.06) Kumamoto (Type 2) 69%70%-- UKPDS 17-21%24-33%-16%*(p=0.052)
 63%54%60%41%*(p=0.06) Kumamoto (Type 2) 69%70%-- UKPDS 17-21%24-33%-16%*(p=0.052).")
50
CVD in Diabetes Therapies that Make a Difference Treatment Glucose lowering HTNHyperlipidemia Aspirin therapy Metformin (ins. resistance) CVD Benefit CV events 15-40% CV events 15-40% CV mortality 25-54% CV mortality 25-54% CV risk 25-55% CV risk 25-55% CV events by 20-61% CV events by 20-61% MI by 25% MI by 25% CVD Benefit CV events 15-40% CV events 15-40% CV mortality 25-54% CV mortality 25-54% CV risk 25-55% CV risk 25-55% CV events by 20-61% CV events by 20-61% MI by 25% MI by 25%
 CVD Benefit CV events 15-40% CV events 15-40% CV mortality 25-54% CV mortality 25-54% CV risk 25-55% CV risk 25-55% CV events by 20-61% CV events by 20-61% MI by 25% MI by 25% CVD Benefit CV events 15-40% CV events 15-40% CV mortality 25-54% CV mortality 25-54% CV risk 25-55% CV risk 25-55% CV events by 20-61% CV events by 20-61% MI by 25% MI by 25%.")
51
GOAL Plasma glucose Plasma glucose - Average preprandial PG (mg/dl) 90-130 - Peak postprandial PG (mg/dl) <180 - HbA 1 C (%) <7 Lipid - Total Chol (mg/dl) <200 (180) - Total Chol (mg/dl) <200 (180) - Triglyceride (mg/dl) <150 - Triglyceride (mg/dl) <150 - HDL-C (mg/dl) >40 - HDL-C (mg/dl) >40 - LDL-C : - LDL-C : - age 135 + risk factor 135 + risk factor < 100 mg/dl - age >40, total chol >135, 30-40% of LDL-C ( 40, total chol >135, 30-40% of LDL-C (< 100) - overt CVD ( very high risk) <70 BP (mmHg) <130/<80 Goal ADA 2005
 Peak postprandial PG (mg/dl) <180 - HbA 1 C (%) <7 Lipid - Total Chol (mg/dl) <200 (180) - Total Chol (mg/dl) <200 (180) - Triglyceride (mg/dl) <150 - Triglyceride (mg/dl) <150 - HDL-C (mg/dl) >40 - HDL-C (mg/dl) >40 - LDL-C : - LDL-C : - age risk factor risk factor < 100 mg/dl - age >40, total chol >135, 30-40% of LDL-C ( 40, total chol >135, 30-40% of LDL-C (< 100) - overt CVD ( very high risk) <70 BP (mmHg) <130/<80 Goal ADA 2005")
52
UKPDS: Glycemic Control Study 5,102 patients treated with diet (3 months) Conventional therapy (n=1,138) Initial therapy - medical nutrition Target FPG < 270 mg/dL (13.5 mmol/L) 4,209 patients randomized (82%) Intensive therapy (n=3,071) *Initial drug monotherapy Target FPG < 108mg/dL (6 mmol/L) Metformin Overweight only n=342Sulfonylureas Initial therapy n=1573Insulin Single-multi injection n=1156 * These therapies were combined or changed to maintain target UKPDS Group: Lancet 1998; 352, 837-853. Mean duration of follow-up 11 years

53
6 7 8 9 03691215 Years from randomization Conventional Intensive 6.2% upper limit of normal range Intensive Treatment versus Conventional Therapy for Type 2 Diabetes: UK Prospective Diabetes Study Mean 7.9% Mean 7.0% HbA1c (%) UKPDS Group. Lancet. 1998;352:837-853.

54
UKPDS :Post-Trial Monitoring 292 Less-tight control 592 Tight control 1997 # in survivor cohort 2002 Clinic 2007 # with final year data Questionnaire 126 Less-tight control 250 Tight control P Mortality 51% (584) Lost-to-follow-up 2.0% (23) Mean age 63±8 years
 Lost-to-follow-up 2.0% (23) Mean age 63±8 years")
55
Post-Trial Changes in HbA 1c UKPDS results presented Mean (95%CI)
")
56
After median 8.5 years post-trial follow-up Aggregate Endpoint 19972007 Any diabetes related endpoint RRR: 12%9% P: 0.029 0.040 Microvascular disease RRR: 25%24% P: 0.00990.001 Myocardial infarction RRR: 16%15% P: 0.0520.014 All-cause mortality RRR: 6%13% P: 0.440.007 RRR = Relative Risk Reduction, P = Log Rank Legacy Effect of Earlier Glucose Control Hyperglycemic memory

57
Glycemic goals of therapy According to DCCT, UKPDS, Kumamoto, recent recommendation for HbA1c –ADA HbA1c < 7% –IDF HbA1c < 6.5% (upper limit for non-diabetic, HbA1c 6.1%) Recently from ACCORD, ADVANCE, VADT Diabetes Care 32:1-11, Dec 2008
 Recently from ACCORD, ADVANCE, VADT Diabetes Care 32:1-11, Dec 2008")
58
Tight glycemic control and cardiovascular disease : ACCORD, ADVANCE, VADT Study no (patients) Average age (y) Duration of DM (y) Duration F/U (y) HbA1cbeforeafter(intensive/conventional)ACCORD10,25162.2103.58.16.4/7.5ADVANCE11,14066857.56.5/7.3VADT1,7916011.56.259.48.4/6.9 ADVANCE Group. N Eng J Med 2008; 358: 2560-72 ACCORD group. N Eng J Med 2008; 358: 2545-2559 VADT Group. In press.

59
Outcomes ACCORD 1° Outcome HR 0.9, p 0.16 (95% CI 0.78-1.04) (nonfatal MI, nonfatal stroke, CVS death) 2° Outcome HR 1.22, p 0.04 (95% 1.01-1.46) (any cause of death) ADVANCE 1° Outcome HR 0.9, p 0.01 (95% CI 0.82-0.98) (composites of major macrovascular / microvascular events) 2° Outcome HR 0.79, p 0.006 (95% 0.66-0.93) (incidence of nephropathy) NS for death from any cause, death from CVS, and retinopathy VADT - No significant differences in cardiovascular events or death between the two groups ADVANCE Group. N Eng J Med 2008; 358: 2560-72ACCORD group. N Eng J Med 2008; 358: 2545-2559VADT Group. In press.

60
The ADA/EASD Management Algorithm 2008 * Check HbA 1c every 3 months until HbA 1c <7%, and then at least every 6 months ** a Sulfonylurea other than glybenclamide or chorpropamide *** b Insufficient clinical use to be confident regarding safety Nathan DM et al. Diabetes Care 2008;31(12). Nathan DM et al. Diabetologia 2008. STEP 1 Lifestyle + Metformin + Sulfonylurea a At diagnosis: Lifestyle + Metformin Lifestyle + Metformin + Basal insulin Lifestyle + Metformin + Intensive insulin Lifestyle + Metformin + GLP-1 agonist b No hypoglycemia Weight loss Nausea/Vomitting Lifestyle + Metformin + Pioglitazone No hypoglycemia Oedema/CHF Bone loss Lifestyle + Metformin + Basal insulin Lifestyle + Metformin + Pioglitazone + Sulfonylurea a Tier 1: Well-validated core therapies Tier 2: Less well-validated core therapies STEP 2STEP 3
. Nathan DM et al. Diabetologia STEP 1 Lifestyle + Metformin + Sulfonylurea a At diagnosis: Lifestyle + Metformin Lifestyle + Metformin + Basal insulin Lifestyle + Metformin + Intensive insulin Lifestyle + Metformin + GLP-1 agonist b No hypoglycemia Weight loss Nausea/Vomitting Lifestyle + Metformin + Pioglitazone No hypoglycemia Oedema/CHF Bone loss Lifestyle + Metformin + Basal insulin Lifestyle + Metformin + Pioglitazone + Sulfonylurea a Tier 1: Well-validated core therapies Tier 2: Less well-validated core therapies STEP 2STEP 3.")
61
Algorithm for the metabolic management Preprandial glucose 70-130 mg/d Postprandial glucose < 180 mg/dl Check A1c q 3m until <7% then q 6m (Sulfonylurea other than glibenclamide and chlorpropamide) Diabetes Care 32:1-11, Dec 2008
 Diabetes Care 32:1-11, Dec 2008")
62
Defined glycemic targets in type 2 DM Glucose control HealthyADA 1 AACE 2 JDS 3 IDF 4 HbA1c (%)< 6< 7≤ 6.55.8–6.4≤ 6.5 Mean FPG a (mg/dl) < 10090-130<110100-11980-110 Mean postprandial PG b (mg/dl) <140<180<140- a 1-2 hours postprandial, b 2 hours postprandial 1. American Diabetes Association. Diabetes Care 2008 2. American Association of Clinical Endocrinologists. Endocr Pract 2002 3. Japan Diabetes Society 4. International Diabetes Federation. Diabet Med 1999

63
Conservative management of glycaemia: traditional stepwise approach 7 6 9 8 HbA 1c (%) 10 OAD monotherapy DietOAD combination OAD + basal insulin OAD monotherapy uptitration Duration of diabetes OAD + multiple daily insulin injections
 10 OAD monotherapy DietOAD combination OAD + basal insulin OAD monotherapy uptitration Duration of diabetes OAD + multiple daily insulin injections")
64
Proactive management of glycaemia: early combination approach OAD + basal insulin OAD + multiple daily insulin injections Diet OAD monotherapy OAD combinations OADs uptitration Duration of diabetes 7 6 9 8 HbA 1c (%) 10
 10")
65
Stepwise Intensification of Treatment for Continuity of Control Progressive deterioration of -cell function Lifestyle changes Oral agents Basal Add basal insulin and titrate Basal plus Add prandial insulin at main meal Basal bolus Additional prandial doses as needed FBG above target HbA 1c above target FBG at target HbA 1c above target Adapted from Raccah D et al. Diabetes Obes Metab 2008;10(2):76-82.
:")
66
Diabetes educators (เภสัช, พยาบาล) แพทย์ นัก โภชนากา ร ใ
 แพทย์ นัก โภชนากา ร ใ")
67
Current management often fails to achieve glycaemic targets 1 Xingbao C. Chinese Health Economics 2003; Ling T. China Diabetic Journal 2003. 2 Harris SB et al. Diabetes Res Clin Pract 2005; 70:90 – 97. 3 Saydah SH, et al. JAMA 2004; 291:335–342. 4 Liebl A, et al. Diabetologia 2002; 45:S23–S28. UNITED STATES (NHANES) 3 HbA 1c < 7% 37% 63% EUROPE (CODE-2) 4 HbA 1c < 6.5% 31% 69% CANADA (DICE) 2 HbA 1c 7% 51% 49% CHINA (CODIC-2) 1 HbA 1c < 7.5% 68% 32%
 3 HbA 1c < 7% 37% 63% EUROPE (CODE-2) 4 HbA 1c < 6.5% 31% 69% CANADA (DICE) 2 HbA 1c 7% 51% 49% CHINA (CODIC-2) 1 HbA 1c < 7.5% 68% 32%.")
68
Two thirds of individuals do not achieve target HbA 1c Saydah SH, et al. JAMA 2004; 291:335–342. Liebl A, et al. Diabetologia 2002; 45:S23–S28. Diabetes Registry Project 2003 The Endocrine Society of Thailand

69
Oral hypoglycemic agents Insulin secretagogues –Sulfonylureas –Non SU: Glinides –DPP 4 Inhibitor –GLP 1 Insulin sensitizers –Biguanides –Thaiazolidinedione : Glitazones Delayed glucose absorption – -glucosidase inhibitors

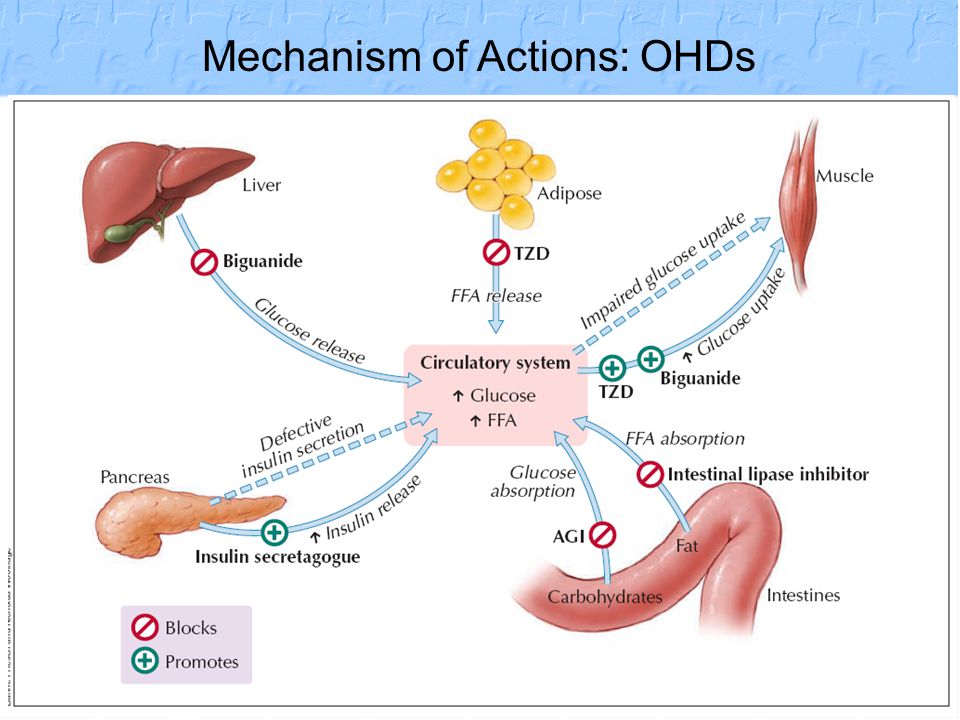
71
Mechanism of Actions: OHDs

73
What does GLP-1 do?

งานนำเสนอที่คล้ายกัน


 1 2 3 4 5 6 7 8 9 10 2 4 6 8 10 12 14 16 18 20 3 6 9 12 15 18.>")

 98.08% 100.02% จังหวัด.>")
 ปี 57 เกิด 3 จับ 2 ราย (66.67.00% ) คดีเท่ากัน ผลการจับกุมบรรลุเป้า ( เป้า 75.47 %)>")
 MICU 68% CCU 32%>")


น.พ.นภดล สุชาติ พ.บ. M.P.H.>")