ดาวน์โหลดงานนำเสนอ
งานนำเสนอกำลังจะดาวน์โหลด โปรดรอ

1
t-test Dr. Tipsuda Janjamlha 23 Aug 08

2
1 one group t-test. 2 two independent groups t-test 3 two paired (dependent) groups t-test t-test : Compute mean differences
 groups t-test t-test : Compute mean differences.")
3
1 one group t-test compare ‘gr. mean’ with ‘constant’ A class of 30 students is given special training to improve intelligence. After training, are their IQ significantly different from 100 ? 105 112 128 98 98 106 116 124 98 97 107 125 106….. 100

4
2 two independent groups t-test To compare means of two independent samples. Ex. Measurements on the two difference samples Analysis performed on differences between group means 105 112 128 98 106 116 124 98 107 125 106….. 112 128 98 98 124 98 97 125 ….. GROUP 1GROUP 2

5
3 two paired (dependent) groups t-test To compare means of two non-dependent samples. Ex. Measurements on the same individuals before and after a treatment Analysis performed on differences between individual pairs of observations 105 112 128 98 106 116 124 98 107 106….. 112 128 98 98 124 98 97 125 ….. GROUP 1GROUP 2

6
3 two paired (dependent) groups t-test SUBJECTData1Data2Difference 1105112 -7 2112128 -16 3128 98 -30 4 98 98 0 5106105 1 6124 124 0 7 98 98 0 etc. etc.etc. etc.

7
A Comparison of one or two group’s means

8
gender male female Space satisfaction Question- naire: 9 items 1.. 2.. … 9.. building Window views Illness recover duration natural

9
ผู้ชายเก็บความลับเก่งกว่าผู้หญิง ผู้ใช้ครีมหน้าเด้งยี่ห้อ A มีความพึงพอใจระดับมากในความเด้ง คนอายุมากกับคนอายุน้อยมีความขี้บ่นแตกต่างกัน ปริมาณผมบนศีรษะมีความสัมพันธ์กับอาการใจน้อย วัยรุ่นมักจะขับรถเร็วกว่าที่กฎหมายกำหนด (90 km/hr) นักศึกษา APTU ใช้เวลานอนแตกต่างจากนักศึกษาคณะอื่น มีค่าเฉลี่ยเวลานอนอย่างน้อย 1 คู่ที่ แตกต่างกัน
 นักศึกษา APTU ใช้เวลานอนแตกต่างจากนักศึกษาคณะอื่น มีค่าเฉลี่ยเวลานอนอย่างน้อย 1 คู่ที่ แตกต่างกัน")
10
Steps in t-test Find other methods Yes No To test assumption of normality: - Explore the skewness, and kurtosis (-1 and + 1) - Kolmogorov – Smirnov and Shapiro – Wilk test Non- parametric stat. No Yes Assumption of normality Is the DV : interval/ratio and IV : nominal level? Independent Pair Compute the independent t testCompute the pair t test Is there a pair or independent gr.?

11
Not reject Ho, no difference at all Is the p-value for the t test <= alpha? No Decision about Hypotheses: Reject Ho, difference between group Yes Assumption of Equal Variances: See the p-value for the Levene’s test for equality of variances p-value < alpha: not assumed p-value > alpha: assumed Equality not assumed Equality assumed

12
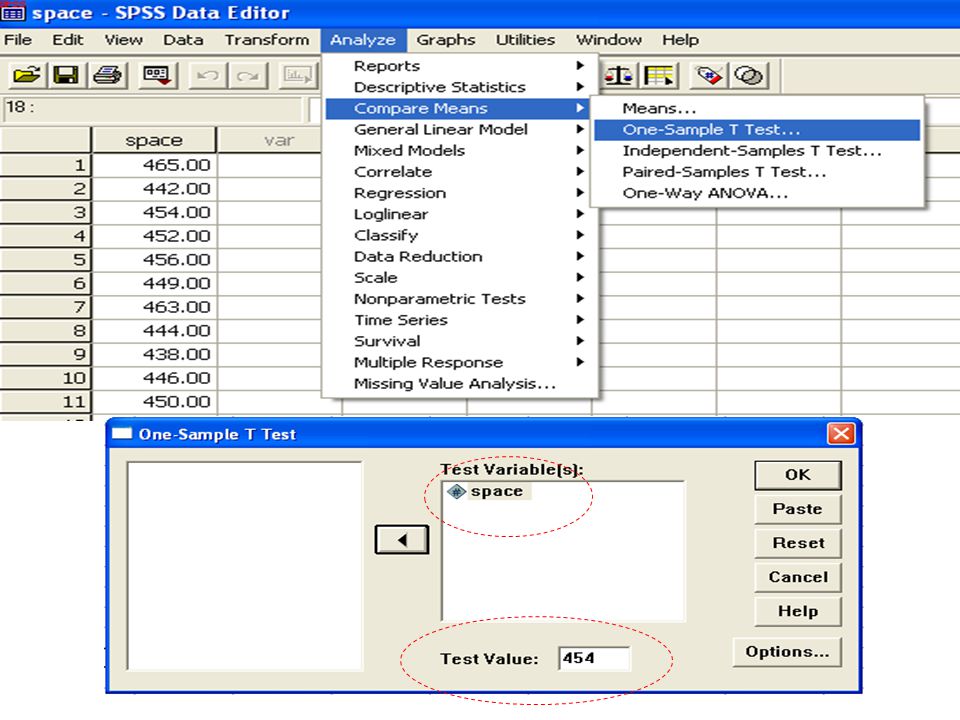
The researcher wants to examine ‘the personal space bubble’ of the TU students. Sample: 24 TU students. The international standard of the student space is 454 cm 2 /person 465456438454447449 442449446447468433 454463450446447456 452444447456 435 Do the data provide sufficient evidence to conclude that the personal space bubble of the TU students is different from the international standard (454 cm 2 /person). Case1: 1 group t-test
. Case1: 1 group t-test.")
13
Test of normality: analysis > descriptive statistics > explore…

15
1 2 3 Interpretation 1.The TU student personal space is 450 cm 2, SD =8.663 2.t = -2.262,df=23,p=.033,so the TU space mean is not equal to 454 cm 2 (standard) ‘TU space is less than the standard space’
 ‘TU space is less than the standard space’")
16
Crowding perception of 30 apartment residents and house residents in Bangkok. apartment residentshouse residents 34.537.554.352.440.054.335.757.138.386.248.546.435.0 32.876.441.231.224.252.859.046.758.959.337.844.376.7 30.738.150.833.051.770.931.738.343.735.643.834.526.5 42.762.731.438.363.523.950.250.534.642.924.222.828.8 37.841.837.656.347.439.842.775.847.6 50.755.971.2 Case2 : independent groups t-test Resident types apartment Crowing perception (Quantitative data) house
 house.")
17
Test of normality: analysis > descriptive statistics > explore…

19
1. การทดสอบ Levene test for Equality Ho : Ha : F= 0.052, p=.820 p> α (.05), so equal variances assumed 1 1 2
, so equal variances assumed")
20
t = -.635, p =.529 p > α(.05), so not reject Ho. There is no significant difference in crowding perception mean between apartment and house residents. mean difference testing: Ho : Ha : 2 interpretation คนที่อาศัยในอพาร์ทเมนท์มีการรับรู้ความหนาแน่นเฉลี่ย ไม่แตกต่างจากคนที่อาศัยในบ้าน

21
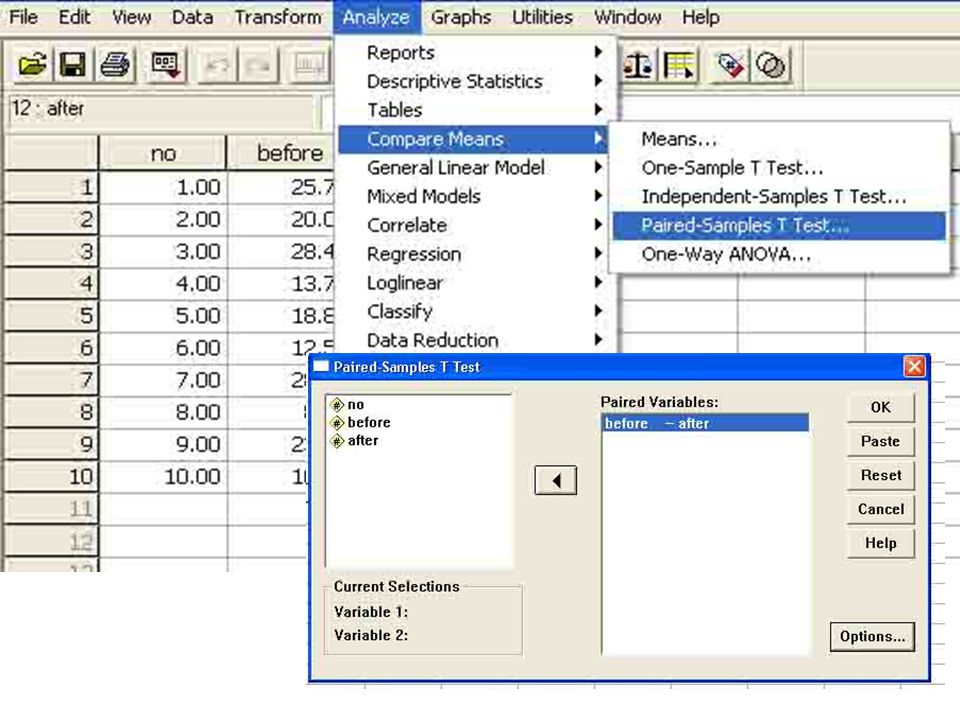
Car mileages, before and after added a new gasoline. CARbeforeafter 125.724.9 220.018.8 328.427.7 413.713.0 518.817.8 612.511.3 728.427.8 88.18.2 923.1 1010.49.9 Case3 : pair ( dependent ) groups t-test
 groups t-test.")
23
t = 4.714, p=.001 p < α (.05), so reject Ho. There is a.05 significant difference in car mileage mean between before and after added a new gasoline. After adding the gas, the car has a shorter mileage. ค่าเฉลี่ยระยะทางก่อนและหลังเติม gasoline แตกต่าง กันอย่างมีนัยสำคัญทางสถิติที่ระดับ.05 โดยหลังเติม gasoline รถมีระยะทางการวิ่งลดลง

งานนำเสนอที่คล้ายกัน


 คงเหลือ : เบิกจ่าย กระทรวงสาธารณสุข ข้อมูล ณ 30 เมษายน 2552 งบประจำทั้งกระทรวง 57.14% สพฉ. 100.00% สวรส. 100.00%>")
 คงเหลือ : เบิกจ่าย กระทรวงสาธารณสุข ข้อมูล ณ 30 มิถุนายน 2552 งบประจำทั้งกระทรวง 73.87% สพฉ. 100.00% สวรส. 100.00%>")


