ดาวน์โหลดงานนำเสนอ
งานนำเสนอกำลังจะดาวน์โหลด โปรดรอ

1
หลักการในการนำข้อมูลจากฐานข้อมูล เพื่อวิเคราะห์แนวโน้มของโรค
วีระศักดิ์ จงสู่วิวัฒน์วงศ์ หัชชา ศรีปลั่ง Edward McNeil หน่วยระบาดวิทยา คณะแพทยศาสตร์ มหาวิทยาลัยสงขลานครินทร์ หาดใหญ่ 6 กรกฎาคม 2554

2
หัวข้อที่จะบรรยาย แหล่งที่มาของข้อมูลที่จะใช้ในการพยากรณ์สุขภาพ ในอนาคต การวิเคราะห์อนุกรมเวลา (time series analysis) การวิเคราะห์แบบ Age-period-cohort model Out-break detection & early warning system

3
ที่มาของข้อมูลสำหรับพยากรณ์สุขภาพประชากร
National census Population registration Routine service database Routine resource transaction database Surveillance Surveys & special studies

4
National Census ทำทุก 10 ปี ข้อมูลทุกพื้นที่ ทุกคน
รายละเอียดจำกัด เน้นเฉพาะการเกิด การตาย (และการย้ายถิ่น) Interpolation statistics ใช้สำหรับ project (extrapolate) โครงสร้างประชากรในอนาคต
 Interpolation statistics ใช้สำหรับ project (extrapolate) โครงสร้างประชากรในอนาคต.")
5
Population registration
เป็นฐานข้อมูลเพื่อความมั่นคงและสิทธิของพลเมือง และการรักษากฎหมาย (กระทรวงมหาดไทย เลขสิบ สามหลัก ทะเบียนบ้าน) ขึ้นกับผู้แจ้ง ในสถานพยาบาล ที่บ้าน มีผลต่อสิทธิประโยชน์ของเจ้าตัว อาจจะทำให้เกิด bias ถ้าไม่เกิดประโยชน์ หรือไม่เข้าใจสิทธิก็จะไม่แจ้ง
 ขึ้นกับผู้แจ้ง. ในสถานพยาบาล. ที่บ้าน. มีผลต่อสิทธิประโยชน์ของเจ้าตัว อาจจะทำให้เกิด bias. ถ้าไม่เกิดประโยชน์ หรือไม่เข้าใจสิทธิก็จะไม่แจ้ง.")
6
Routine service database
เกิดขึ้นในสถานบริการรักษาพยาบาล กำหนดโดยกฏหมาย และ ความต้องการของผู้วางแผน (สนย. สปสช ฯลฯ) อาจจะมีผลทางการเงินต่อสถานพยาบาล แต่ไม่มีผล ทางกฎหมาย มาตรฐานของแต่ละโรงพยาบาลอาจจะไม่เหมือนกัน ขึ้นกับความสนใจของแพทย์และนักเวชสถิติ
 อาจจะมีผลทางการเงินต่อสถานพยาบาล แต่ไม่มีผล ทางกฎหมาย. มาตรฐานของแต่ละโรงพยาบาลอาจจะไม่เหมือนกัน ขึ้นกับความสนใจของแพทย์และนักเวชสถิติ")
7
Routine resource transaction database
ทรัพยากรที่จัดสรร ได้แก่ ทรัพยากรมนุษย์ การเงิน การ ลงทุน วัสดุ คุรุภัณฑ์ เวชภัณฑ์ ทะเบียนการเจ้าหน้าที่มีผลทางกฎหมายระยะยาว (สิทธิบำนาญ ฯลฯ) แต่ส่วนอื่นมีผลทางกฎหมายน้อย มีการลงทุนด้านฐานข้อมูลค่อนข้างน้อย การเปลี่ยนแปลงของการจัดสรรทรัพยากรขึ้นกับ อิทธิพลของนักการเมืองและข้าราชการประจำ
 แต่ส่วนอื่นมีผลทางกฎหมายน้อย. มีการลงทุนด้านฐานข้อมูลค่อนข้างน้อย. การเปลี่ยนแปลงของการจัดสรรทรัพยากรขึ้นกับ อิทธิพลของนักการเมืองและข้าราชการประจำ.")
8
Surveillance เป็นเรื่องของหน่วยงานกลางเป็นส่วนใหญ่
อาจจะซ้ำซ้อนภายในกรมเดียวกันแต่ต่างสำนัก โดยเฉพาะโรคติดต่อสำคัญ เช่น วัณโรค มาลาเรีย ได้สถิติด้านอุบัติการณ์ (รายใหม่) แต่ระยะการ ติดตามผู้ป่วยมักจะสั้น
 แต่ระยะการ ติดตามผู้ป่วยมักจะสั้น.")
9
Surveys & special studies
จัดทำขึ้นเพื่อวัตถุประสงค์จำเพาะ คุณภาพข้อมูลดี แต่ความครอบคลุมหรือการเป็น ตัวแทนประชากรอาจจะมีปัญหาเนื่องจากต้องใช้ต้นทุน สูง Survey ได้สถิติด้านความชุก เหมาะสำหรับการเจ็บป่วย เรื้อรังและพฤติกรรมระยะยาว Cohort study แพงมาก ทำได้ยาก ต้องการนักวิจัยที่มี commitment สูง

10
การนำข้อมูลเหล่านี้มาใช้พยากรณ์
พยากรณ์โครงสร้างของกลุ่มอายุและกลุ่มเสี่ยงจากสำ มะโนและฐานข้อมูลหลาย ๆ ทศวรรษ ติดตามแนวโน้มอุบัติการณ์ของโรคจากฐานข้อมูลการ เฝ้าระวังเฉพาะโรค วิเคราะห์แนวโน้มของปัจจัยเสี่ยงที่ค้นพบจากงานวิจัย ต่าง ๆ นำปัจจัยด้านการบริการสาธารณสุขเข้าไปร่วมพิจารณา

11
Age-Period-Cohort (APC)
วัยเด็กยังไม่มีภูมิคุ้มกันต่อโรคติดต่อบางชนิดซึ่งผู้ใหญ่มี เมื่ออายุมากขึ้นโรคจากความเสื่อมจะเพิ่มขึ้น Period เป็นความแตกต่างเนื่องจากยุคสมัย เช่น สมัยใหม่มีอาหารการ กินอุดมสมบูรณ์ สิ่งอำนวยความสะดวกครบครัน ใช้แรงงานน้อย Cohort คือ birth cohort หรือ คนรุ่นเดียวกัน Cohort เดียวกันผ่าน period เดียวกันเมื่อวัยเดียวกัน Interaction ของปัจจัยใด ๆ สองปัจจัยจะเป็นผลของปัจจัยที่สาม

12
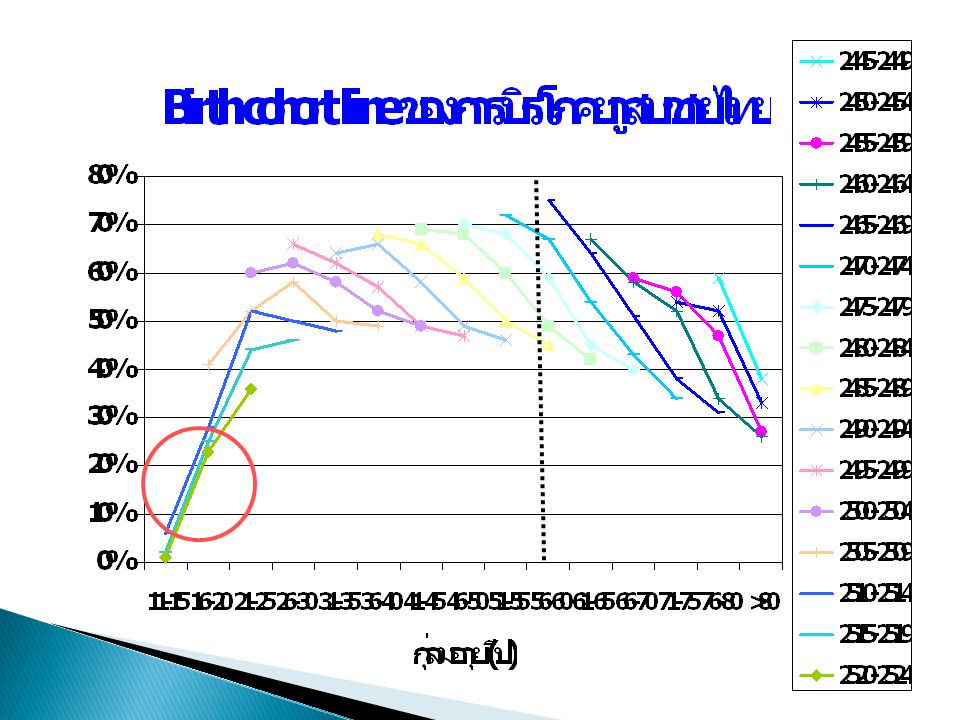
วิธีการวิเคราะห์ APC ต้องมีข้อมูลที่มีแบบฟอร์มเดียวกันซ้ำ ๆ ต่อเนื่องหลาย ๆ ทศวรรษ (period) ผลลัพธ์เบื้องต้น คือ age-specific rate ในแต่ละ period ได้ หรือ cohort-specific rate ในแต่ละ period หรือ age-specific rate ในแต่ละ cohort แสดงด้วย cohort line หาอิทธิพลของแต่ละ term โดยปรับ confounding ต่าง ๆ ด้วย statistical modeling

13
Disease projection จาก APC modeling
การพยากรณ์อนาคตโดยใช้ระบบ APC ต้องประสานกับ นักประชากรศาสตร์ เพื่อให้ทราบขนาดของแต่ละ cohort ในแต่ละ period จากนี้จึงคูณด้วยสัมประสิทธิ์ของปัจจัย ทั้งสองประมาณค่าของโรคในแต่ละระยะของอนาคตได้

15
Female breast cancer in Thailand
Year Thai Network of Cancer Registries Hutcha Sriplung

16
Cervix uteri cancer in Thailand
Hutcha Sriplung Thai Network of Cancer Registries

17
Male colo-rectal cancer in Thailand
ASR /100,000 population Year Hutcha Sriplung Thai Network of Cancer Registries

18
Male colo-rectal cancer in Thailand
ASR /100,000 population prevalent case? Year Hutcha Sriplung Thai Network of Cancer Registries

19
Male colo-rectal cancer in Thailand
ASR /100,000 population prevalent case? Year Do regression without the first points. Hutcha Sriplung Thai Network of Cancer Registries

20
Tobacco consumption and lung cancer in Australia
3.0 1.5 0.0 2.0 1.0 2.5 Tobacco Kg/capita Death/100,000 population Year ~20 years AIHW: deloop M & Bhatia K 2001: Australian Health Trends AIHW Cat. No. PHE 24. Canberra: AIHW; the National Mortality Database. Hutcha Sriplung Thai Network of Cancer Registries

21
Examples of Age-period-cohort analysis
Pancreatic cancer incidence in Finland: relatively unchanged over time Thai Network of Cancer Registries Hutcha Sriplung

22
Examples of Age-period-cohort analysis
Endometrial cancer incidence in Sweden: declining in pre-menopausal women and later cohorts Hutcha Sriplung Thai Network of Cancer Registries

23
Examples of Age-period-cohort analysis
Breast cancer in Songkhla: increasing in all cohorts, periods, and age groups Hutcha Sriplung Thai Network of Cancer Registries

24
Time series analysis

25
General features of time series analysis
A variant of multiple regression dealing with time- series data Time series data mainly consist of outcome over time. Ordinary multiple regression is inefficient in this case due to huge number of parameters.

26
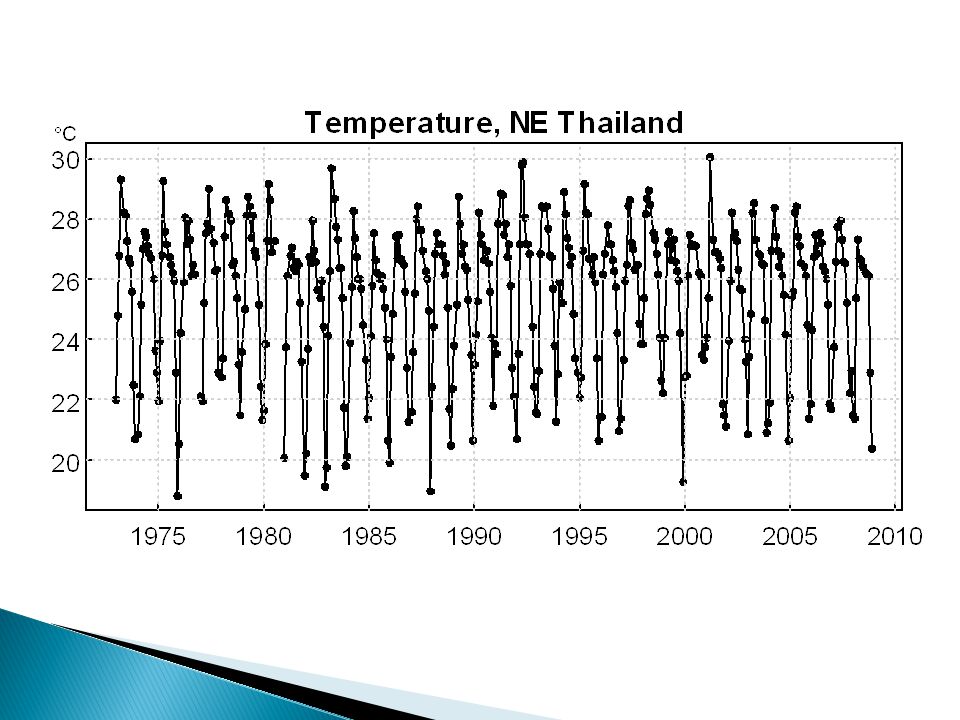
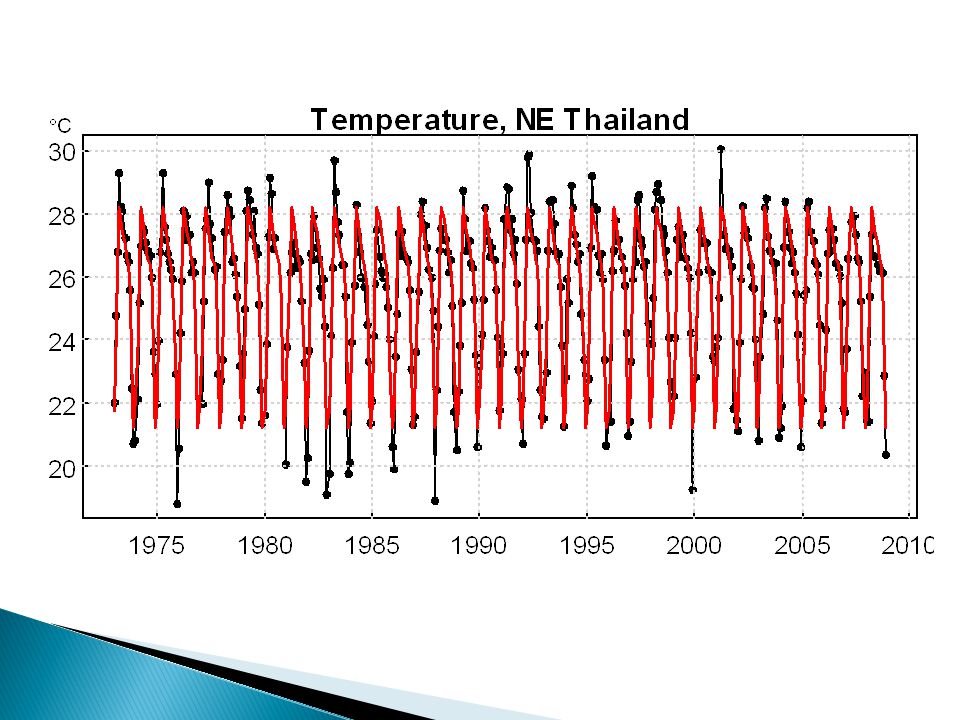
Main composition of determinants
Trend: linear, curvinear, moving average Oscillation (cosine function) Harmonic terms e.g. cos(a), cos(2a) Starting points e.g. cos(m+a), cos(n+2a) Autoregressive effect Preceding status has effects on the current one. Optionally other explanatory independent terms e.g. temperature, rainfalls, which are beyond the trend and cyclical effects Random errors
 Harmonic terms e.g. cos(a), cos(2a) Starting points e.g. cos(m+a), cos(n+2a) Autoregressive effect. Preceding status has effects on the current one. Optionally other explanatory independent terms e.g. temperature, rainfalls, which are beyond the trend and cyclical effects. Random errors.")
30
Forecasting malaria in Yala

31
Outbreak detection & early warning system

32
Outbreak definition Outbreak ต่างกับ epidemic อย่างไร
Any number of cases of a serious communicable disease Abnormal increase of incidence Seasonally adjusted Not seasonally adjusted

33
Problems of outbreak detection
Long incubation period -> multiple point sources -> unclear increase of incidence Rapid transportation, highly mobile population, rare infection -> meta-surveillance needed ie combining data from various geographic area

34
Examples of problematic diseases
Long incubation period TB, HIV Hepatitis Mobile population Leptospirosis among tourists Rare but important infection Legionnaire pneumonia

35
Example of NISS in Yunnan CDC
All cases of hepatitis A cases have been reported, verified and registered in NISS database Analysis showed 8% duplicated cases Outbreaks searched by 7-day moving summation. Nine outbreaks detected in different counties. Of these only 4 had been reported.

36
Tackling outbreaks If the outbreak is undetected, the disease may continue to spread or become endemic. The earlier the report is, the more timely the system can respond. Tools to control outbreak may include: sanitation improvement, case isolation, quarantine, mass education & immunization etc.

37
Early warning system Routine daily check immediate past few days against a certain values Long history (multi-year season adjustment) Short history (immediate preceding values in the same year) An abnormal increase can be detected early and the signal fired.
 An abnormal increase can be detected early and the signal fired.")
38
Parameters of performance of the early warning system
Sensitivity % of outbreak preceded by an alarm Positive predictive value % of alarms actually followed by an outbreak Timeliness Number of days the signal would alarm after the outbreak started Alarm benefit Number of days the signal would alarm before the outbreak was reported

39
สรุป การพยากรณ์โรคโดยวิธีการทางสถิติมีหลักการและทฤษฎีหลาย ประการ แต่ละวิธีมีจุดแข็งจุดอ่อนต่างกัน และเหมาะสมสำหรับโรคที่ไม่ เหมือนกัน การตรวจสอบอัตราการรายงาน outbreak เป็นสิ่งที่ทำง่ายและน่าทำ การวิเคราะห์ early warning system น่าจะพอทำได้ ควรประเมินสำหรับ แต่ละโรคและพื้นที่ว่าควรจะติดตั้ง alarm system หรือไม่ APC and time series analysis ทำยาก ต้องใช้เวลานานในการเรียนรู้

งานนำเสนอที่คล้ายกัน


>")


 สำนักงานกองทุนสนับสนุนการวิจัย คณะวิศวกรรมศาสตร์ กำแพงแสน มหาวิทยาลัยเกษตรศาสตร์>")
 ที่เกี่ยวข้องกับการแพทย์แผนไทย>")


>")


