ดาวน์โหลดงานนำเสนอ
งานนำเสนอกำลังจะดาวน์โหลด โปรดรอ

1
วรุตม์ เกียรติธนะบำรุง 5030475821
Calibration of Thermocouple ปวีร์ ภัทรดิลก พบพงศ์ เลิศชยานันท์ วรุตม์ เกียรติธนะบำรุง วสวัตติ์ รอดจั่น อุกฎษฎ์ สุวรรณกูฎ

2
Objective To gain some understanding on the theory underlying the thermoelectric temperature measurement, especially thermocouples and develop some expertise in the measurement of temperature with thermocouples. To gain understanding on the concept of calibration and basic process of calibrating an instrument. Specifically to realize the purpose of calibration, why an instrument should be calibrated before use.

3
(electromotive force) emf
What is Thermocouple ? A thermocouple is a junction formed from two different metals that produces a voltage when subjected to a temperature difference. Thermocouples are a widely used type of temperature sensor. thermocouple The temperature difference DT is converted to voltage (electromotive force) Voltage (electromotive force) emf
 Voltage. (electromotive force) emf.")
4
Functional form Where : is the type of thermocouple.
is the temperature at measuring junction of the thermocouple. is the temperature at the reference junction is the electromotive force (voltage).
.")
5
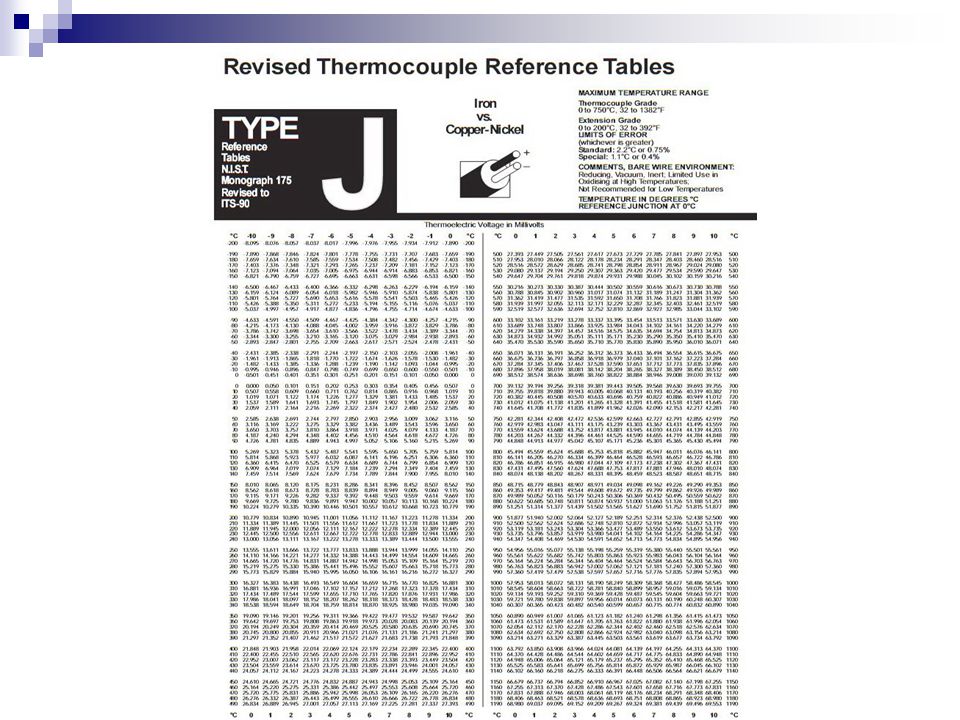
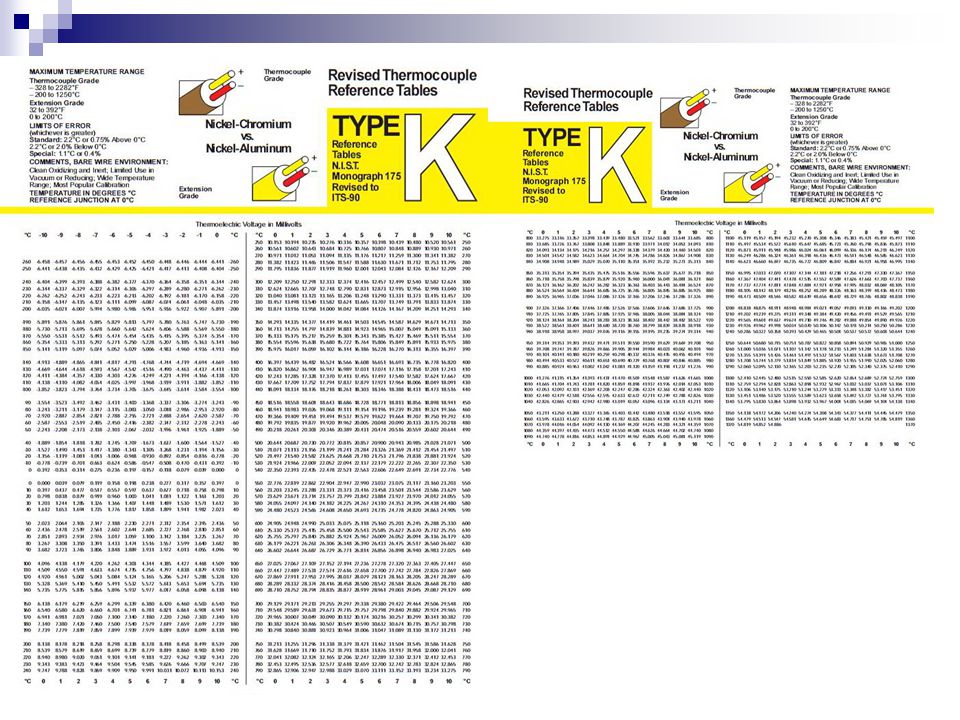
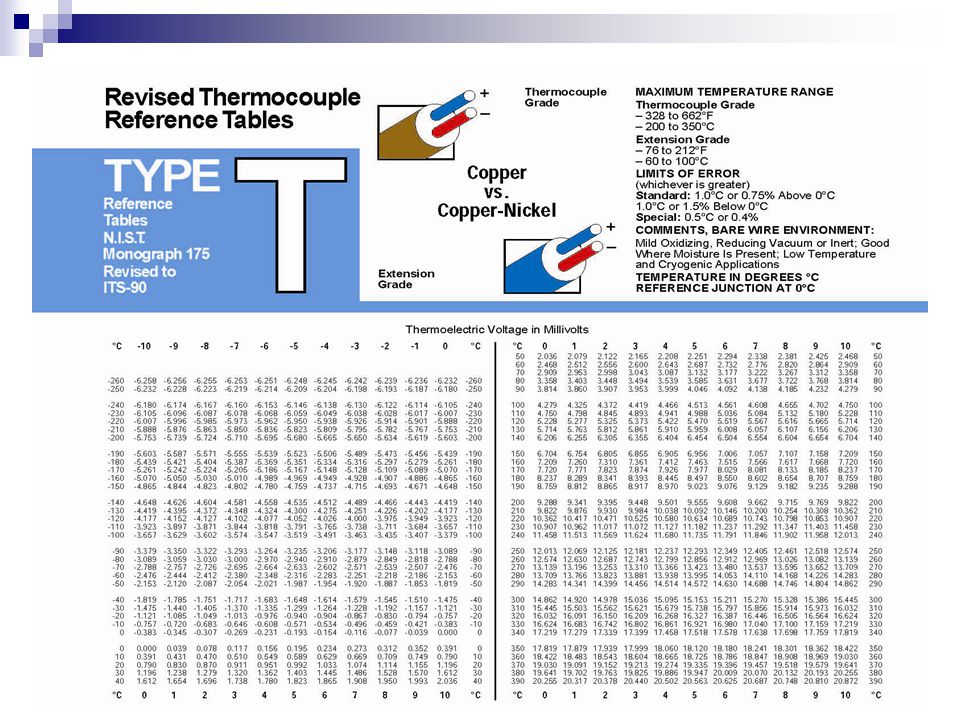
Type of Thermocouples Type Materials Temperature Range Sensitivity E
Chromel (Ni-Cr) & Constantan (Cu-Ni) -270 to 1000°C 60.9 μV/°C J Iron & Constantan (Cu-Ni) -210 to 1200°C 51.7 μ V/°C K Chromel (Ni-Cr) & Alumel (Ni-Al) -270 to 1350°C 40.6 μ V/°C T Copper & Constantan (Cu-Ni) -270 to 400°C R Platinum & 87%Platinum -50 to 1750°C 6 μ V/°C S 90% Platinum & 10% Rhodium B 94% Platinum & 6% Rhodium
 & Constantan (Cu-Ni) -270 to 1000°C μV/°C. J. Iron & Constantan (Cu-Ni) -210 to 1200°C μ V/°C. K. Chromel (Ni-Cr) & Alumel (Ni-Al) -270 to 1350°C μ V/°C. T. Copper & Constantan (Cu-Ni) -270 to 400°C. R. Platinum & 87%Platinum. -50 to 1750°C. 6 μ V/°C. S. 90% Platinum & 10% Rhodium. B. 94% Platinum & 6% Rhodium.")
9
การทดลอง

10
Equipment Voltmeter Hot Bath

11
The experiments Finding relation between
Record the voltage of each thermocouple from °C Tref Tmes Hot bath

12
ผลการทดลอง

13
Uncetainty(@95%Confidence)
Thermocouple Type J Temperature (°C) Thermocouple Ref. Table Calibration Result Voltage (mV) Average Voltage (mV) SD 1st 2nd 3 0.151 0.11 0.10 0.105 6 0.303 0.20 0.26 0.230 9 0.456 0.37 0.43 0.400 12 0.609 0.52 0.57 0.545 15 0.762 0.69 0.75 0.720 18 0.916 0.85 0.90 0.875 21 1.071 1.01 1.07 1.040 24 1.226 1.17 1.22 1.195 27 1.381 1.32 1.38 1.350 30 1.537 1.50 1.54 1.520 33 1.693 1.64 1.70 1.670 36 1.849 1.81 1.86 1.835 39 2.006 1.97 2.02 1.995 42 2.164 2.13 2.18 2.155 45 2.322 2.28 2.35 2.315 48 2.480 2.47 2.51 2.490 51 2.638 2.62 2.67 2.645 54 2.797 2.78 2.85 2.815 57 2.956 2.95 3.00 2.975 60 3.116 3.10 3.16 3.130
 Thermocouple Ref. Table. Calibration Result. Voltage (mV) Average Voltage (mV) SD. 1st. 2nd")
14
Graphical Presentation

15
Thermocouple Ref. Table Calibration Result Voltage (mV)
Thermocouple Type K Temperature (°C) Thermocouple Ref. Table Calibration Result Voltage (mV) Average Voltage (mV) SD 1st 2nd 4 0.158 0.08 0.06 0.070 7 0.277 0.20 0.16 0.180 10 0.397 0.31 0.33 0.320 13 0.517 0.45 0.450 16 0.637 0.56 0.560 19 0.758 0.69 0.70 0.695 22 0.879 0.81 0.77 0.790 25 1.000 0.93 0.95 0.940 28 1.122 1.07 1.070 31 1.244 1.18 1.20 1.190 34 1.366 1.31 1.33 1.320 37 1.489 1.43 1.45 1.440 40 1.612 1.53 1.530 43 1.735 1.68 1.66 1.670 46 1.858 1.79 1.82 1.805 49 1.982 1.93 1.95 1.940 52 2.106 2.04 2.06 2.050 55 2.230 2.16 2.19 2.175 58 2.354 2.29 2.31 2.300 61 2.478 2.40 2.45 2.425
 Thermocouple Ref. Table. Calibration Result. Voltage (mV) Average Voltage (mV) SD. 1st. 2nd")
16
Graphical Presentation

17
Uncetainty(@95%Confidence)
Thermocouple Type T Temperature (°C) Thermocouple Ref. Table Calibration Result Voltage (mV) Average Voltage (mV) SD 1st 2nd 5 0.195 0.11 0.16 0.135 8 0.312 0.23 0.29 0.260 11 0.431 0.33 0.41 0.370 14 0.549 0.48 0.53 0.505 17 0.669 0.59 0.65 0.620 20 0.790 0.72 0.77 0.745 23 0.911 0.84 0.88 0.860 26 1.033 0.96 1.01 0.985 29 1.155 1.09 1.13 1.110 32 1.279 1.20 1.26 1.230 35 1.403 1.34 1.38 1.360 38 1.528 1.46 1.52 1.490 41 1.654 1.58 1.63 1.605 44 1.780 1.70 1.75 1.725 47 1.908 1.83 1.89 1.860 50 2.036 1.96 2.01 1.985 53 2.165 2.07 2.14 2.105 56 2.294 2.20 2.27 2.235 59 2.425 2.34 2.40 2.370 62 2.556 2.50 2.51 2.505
 Thermocouple Ref. Table. Calibration Result. Voltage (mV) Average Voltage (mV) SD. 1st. 2nd")
18
Graphical Presentation

19
Graphical Presentation
Note : For distinct graphical presentation, error bars are not shown.

20
Experimental Results -The calibration curves of the T vs emf(voltage) is linear. -Level of error is low. -Slope of calibration curve of type J is more than type K and type T.

21
สรุปผลการทดลอง

22
Conclusion 1.ผลการทดลองที่ได้จากการ Calibrate มีค่าใกล้เคียงกับ Revised Thermocouple Reference Tables 2.Electromotive Force กับอุณหภูมิที่แตกต่างมีความสัมพันธ์กันเป็นเส้นตรง 3.Thermocouple Type J มี Sensitivity มากกว่า Type K,T

23
Appendix

24
Calculation of Uncertainty
Since the information of the voltmeter and hot bath are unknown, so Let And, So, Note : For and @ 95% confidence : ** ** Reference : Inverse Student t Distribution; “Some Aspect of Experimentation”, Mechanical Engineering Experimentation and Laboratory I, Asi Bunyajitradulya (Page 193).
.")
งานนำเสนอที่คล้ายกัน


 คงเหลือ : เบิกจ่าย กระทรวงสาธารณสุข ข้อมูล ณ 31 มกราคม 2552 งบประจำทั้งกระทรวง 32.20% สพฉ. 100.00% สวรส. 99.34%>")
 คงเหลือ : เบิกจ่าย กระทรวงสาธารณสุข ข้อมูล ณ 30 เมษายน 2553 งบประจำทั้งกระทรวง 57.58% สพฉ. 100.00% สปสช. 72.79%>")


>")


>")
