ดาวน์โหลดงานนำเสนอ
งานนำเสนอกำลังจะดาวน์โหลด โปรดรอ

1
ปัญหารบกวนการตรวจวิเคราะห์ทางเคมีคลินิก
และวิธีการแก้ไข เทคนิคการวิเคราะห์ทางเคมีคลินิก Photometry Potentiometry (ion-selective) ปัญหา ผลของปัญหา หรือ ดัชนีแสดง วิธีการแก้ปัญหา กำจัด/ลด ปัญหา หรือยอมรับกรณีอยู่ในเกณฑ์ที่ยอมรับได้
 ปัญหา. ผลของปัญหา หรือ ดัชนีแสดง. วิธีการแก้ปัญหา. กำจัด/ลด ปัญหา. หรือยอมรับกรณีอยู่ในเกณฑ์ที่ยอมรับได้")
2
ปัญหารบกวนการตรวจวิเคราะห์ทางเคมีคลินิก
และวิธีการแก้ไข วัตถุประสงค์การเรียน 1) อธิบายปัญหาที่อาจมีผลต่อการตรวจวิเคราะห์ทางเคมีคลินิกและแนวทางการแก้ไขปัญหา 2) อธิบายวิธีการตรวจสอบการรบกวนของสารต่อการตรวจวิเคราะห์ทางเคมีคลินิก
 อธิบายปัญหาที่อาจมีผลต่อการตรวจวิเคราะห์ทางเคมีคลินิกและแนวทางการแก้ไขปัญหา. 2) อธิบายวิธีการตรวจสอบการรบกวนของสารต่อการตรวจวิเคราะห์ทางเคมีคลินิก.")
3
Photometric measurement process
ตวงปริมาตรผิด Slow decompose ตัวอย่างเสื่อมสภาพ น้ำยาเสื่อมสภาพ / สารทำปฏิกิริยาไม่พอ มีสารรบกวนปฏิกิริยาตรวจวัด สีของตัวอย่าง ความขุ่นของตัวอย่าง สารรบกวน ตัวอย่าง + น้ำยาตรวจวิเคราะห์ ปล่อยให้เกิดปฏิกิริยา Chemical interference Spectral interference Electrical interference Physical interference (Matrix interference) End-point assay Kinetic assay วัดการดูดกลืนแสง บันทึก + คำนวณ + รายงานผล บันทึกผลผิด คำนวณผิด รายงานผิดคน วัดการเกิดปฏิกิริยา ในช่วงเวลาที่ไม่เหมาะสม
 End-point assay. Kinetic assay. วัดการดูดกลืนแสง. บันทึก + คำนวณ + รายงานผล. บันทึกผลผิด. คำนวณผิด. รายงานผิดคน. วัดการเกิดปฏิกิริยา. ในช่วงเวลาที่ไม่เหมาะสม.")
4
Mechanisms of Interference and Sources
ศึกษาเพิ่มเติมใน Interferences in clinical chemistry analysis Article in Indian Journal of Clinical Biochemistry By Saibaba KSS, Bhaskar MV, et al. Interference From Interferences in Laboratory Testing from Chemical artifacts. The interferent may suppress the reaction by competing for reagents or inhibiting indicator reactions. It could also alter the form of the analyte by complexation or precipitation.

5
Mechanisms of Interference
Detection artifacts. The interferent may have properties similar to the analyte, such as fluorescence, color, light scattering, elution position, or electrode response that are detected and measured.

6
Mechanisms of Interference
Physical artifacts. The interferent may alter a physical property of the sample matrix, such as viscosity, surface tension, turbidity, or ionic strength, causing an apparent change in measured analyte concentration.

7
Mechanisms of Interference
Enzyme inhibition. The interferent may alter the activity of an enzyme (analyte or reagent) by sequestering metal activators, binding to the catalytic site, or oxidizing essential sulfhydryl groups. The interferent may also compete for a key substrate in an enzyme- based measurement procedure. For example, adenylate kinase competes with creatine kinase for ADP, and thus is measured falsely as creatine kinase in some measurement procedures.
 by sequestering metal. activators, binding to the catalytic site, or oxidizing. essential sulfhydryl groups. The interferent may. also compete for a key substrate in an enzyme- based measurement procedure. For example, adenylate kinase competes with creatine. kinase for ADP, and thus is measured falsely as creatine. kinase in some measurement procedures.")
8
Mechanisms of Interference
Nonspecificity. The interferent may react in the same manner as the analyte. Although some differentiate nonspecificity from interference, its practical effects are the same to the laboratory. Some common examples: keto acids react in alkaline picrate creatinine measurement procedures; indoxyl sulfate reacts in some diazo bilirubin procedures.

9
ปฏิกิริยาตรวจวัด fructosamine
Eneaminol Fructosamine NBT2+ NBT+ Formazan Reducing substances Problem:

10
ปฏิกิริยาตรวจวัด ALP ALP, Mg2+, pH 10.4 p-nitrophenyl monophosphate +
p-nitrophenol + phosphate Problem: spontaneous liberated p-nitrophenol negative feedback of phosphate ion

11
ปฏิกิริยาตรวจวัด glucose
Glucose Oxidase Glucose + O2 + H2O Gluconic acid + H2O2 Peroxidase H2O2 + Phenol + Amino-4-antipyrine 4(1,4-bezoquinonmonoimino) phenazone = 520 nm Problem: non-enzymatic reaction of the secondary Rx. oxidizing or reducing substances
 phenazone. = 520 nm. Problem: non-enzymatic reaction of the secondary Rx. oxidizing or reducing substances.")
12
Mechanisms of Interference
Cross-reactivity. An interferent structurally similar to an antigen may “cross-react” with the antibody in an immunochemical measurement procedure. This is a form of nonspecificity. For example, caffeine is measured in some theophylline procedures. The degree of cross-reactivity is regarded as a measure of the specificity of an immunochemical method, but it is not a useful measure of its susceptibility to interference.

13
Mechanisms of Interference
= aqueouse phase . = cells or nonaqueous substances Water displacement. Nonaqueous substances (protein, lipids) affect activity-based measurements by displacing aqueous plasma volume. These effects are not considered interference if it is desired to measure the analyte concentration as the concentration in plasma water.
 affect. activity-based measurements by displacing. aqueous plasma volume. These effects are not considered interference if. it is desired to measure the analyte concentration. as the concentration in plasma water.")
14
ISE measurement process
ปัญหาของการตรวจวัด สัญญาณอ้างอิงของการวัดศักย์ไฟฟ้า (ground) ไม่คงที่ การตอบสนองของ electrode (slope) เปลี่ยนไปในระหว่างการตรวจวัด สาเหตุ: - ผิวของ selective membrane สกปรก - electrode เสื่อม Ref Cl K Na Sample detector Sample flow Solving by Measurement Process 1.Sample measurement วัดศักย์ไฟฟ้าฟ้าของ sample เพื่อใช้ในการคำนวณค่า 2.Internal standard / Reference solution measurement วัดศักย์ไฟฟ้าของ Ref. solution เพื่อตรวจสอบความคงที่ในการตอบสนองของ electrode และช่วยลด carry over ระหว่างตัวอย่าง For Checking - slope of electrode - Precision ผู้ใช้ต้องปฏิบัติเพื่อลดปัญหาการตรวจ Clean & De-protein the selective membranes and the chamber or capillary
 ไม่คงที่ การตอบสนองของ electrode (slope) เปลี่ยนไปในระหว่างการตรวจวัด. สาเหตุ: - ผิวของ selective membrane สกปรก. - electrode เสื่อม. Ref. Cl. K. Na. Sample. detector. Sample flow. Solving by Measurement Process. 1.Sample measurement. วัดศักย์ไฟฟ้าฟ้าของ sample เพื่อใช้ในการคำนวณค่า. 2.Internal standard / Reference solution. measurement วัดศักย์ไฟฟ้าของ Ref. solution. เพื่อตรวจสอบความคงที่ในการตอบสนองของ electrode. และช่วยลด carry over ระหว่างตัวอย่าง. For Checking. - slope of electrode. - Precision. ผู้ใช้ต้องปฏิบัติเพื่อลดปัญหาการตรวจ. Clean & De-protein the selective membranes and the chamber or capillary.")
15
ตรวจสอบสารรบกวนวิธีการตรวจวัดทางเคมีคลินิกได้อย่างไร
Analytical Interference of substances Blank sample Chemical added sample นำไปตรวจวัด และ วิเคราะห์ข้อมูล ตัวทำละลายที่ใช้เป็น blank sample ได้แก่ 1: pooled serum or plasma 2: 0.1 ml 0.25 N NaOH and 9.9 ml pooled serum or plasma 3: 0.1 ml 70% ethanol and 9.9 ml pooled serum or plasma Chemical added sample 1: สาร + pooled serum or plasma 2: 0.1 ml Chemical solution ml pooled serum or plasma ** ศึกษาเพิ่มเติมในเอกสาร: Interference and Recovery Experiments From: Writhed by James O. Westgard, and Elsa F.Quam

16
หลังจากเตรียมตัวอย่างที่จะศึกษาได้แล้วให้นำมาตรวจวัด
A. Calibration of the method or system according to the recommendation of the manufacturer B. Measurement of the quality control materials (low and high) C. Pooled serum or plasma without the added chemical (blank sample) (n = 5) D. Five different pooled sera or plasmas with added chemical (n = 2) E. Pooled serum or plasma without added chemical (blank sample) (n = 5) F. Five different pooled sera or plasmas with added chemical (n = 2) and so on.
 C. Pooled serum or plasma without the added chemical. (blank sample) (n = 5) D. Five different pooled sera or plasmas with. added chemical (n = 2) E. Pooled serum or plasma without added chemical. (blank sample) (n = 5) F. Five different pooled sera or plasmas with. added chemical (n = 2) and so on.")
17
Percentages of original values
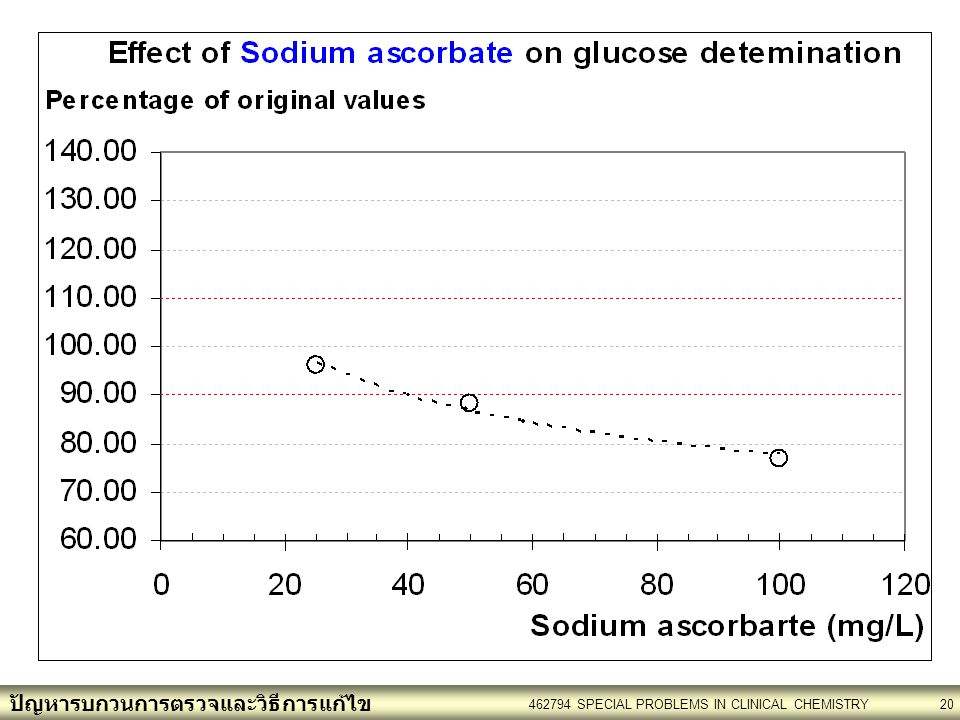
Chemical mg/L Uric acid Triglyceride Glucose %Recover Blank sample 45.5 853 837 Acetylsalicylic acid 150.0 100.00 819 96.01 820 97.97 75.0 836 98.01 37.5 L-Dopa 6.0 33.6 73.85 802 94.02 778 92.95 3.0 39.5 86.81 803 95.94 1.5 42.7 93.85 845 99.06 Sodium ascorbate 100 691 81.01 644 76.94 50 768 90.04 736 87.93 25 811 95.08 Pyrasanone 40.0 87.91 43.5 95.60 45.0 98.90

18
วิเคราะห์ dose response of the interference
mg/L Uric acid r and p Triglyceride Glucose %Recover Blank sample 45.5 853 837 Acetylsalicylic acid 150.0 100.00 819 96.01 820 97.97 75.0 836 98.01 p = p = 37.5 L-Dopa 6.0 33.6 73.85 802 94.02 778 92.95 3.0 39.5 86.81 p = p = 803 95.94 p = 1.5 42.7 93.85 845 99.06 Sodium ascorbate 100 691 81.01 644 76.94 50 768 90.04 p = 736 87.93 p = 25 811 95.08 Pyrasanone 40.0 87.91 43.5 95.60 p = 45.0 98.90

21
Allowable Error For Glucose by CLIA = 10%
mg/L Glucose Interference % Blank sample 837 Acetylsalicylic acid 150.0 820 -2.03 % 75.0 0.00 % 37.5 L-Dopa 6.0 778 -7.05 % 3.0 803 -4.06 % 1.5 Sodium ascorbate 100 644 % 50 736 % 25 Pyrasanone

22
Allowable Error For Uric A by CLIA = 17%
mg/L UricA Interference % Blank sample 45.5 Acetylsalicylic acid 150.0 0.00 % 75.0 37.5 L-Dopa 6.0 33.6 % 3.0 39.5 % 1.5 42.7 -6.15 % Sodium ascorbate 100 50 25 Pyrasanone 40.0 % 43.5 -4.40 % 45.0 -1.10 %

23
Allowable Error For Triglyceride by CLIA = 25%
mg/L Trig Interference % Blank sample 853 Acetylsalicylic acid 150.0 819 -3.99 % 75.0 836 -1.99 % 37.5 0.00 % L-Dopa 6.0 802 -5.98 % 3.0 1.5 845 -0.94 % Sodium ascorbate 100 691 % 50 768 -9.96 % 25 811 -4.92 % Pyrasanone

24
Chemical Interference solving
Dilution Lower detection limit 1:2 dilution Interference Analyte

25
Chemical Interference solving
Interference removing Precipitation Extraction Adsorption Oxidation Detergent addition

26
Chemical Interference solving
Addition Lower detection limit Standard addition Interference Analyte

27
Chemical Interference solving
Increase specificity -Enzymatic reaction -Antigen –antibody reaction -Selective membrane

28
Spectral Interference solving
Sample blank DW + Reagent Sample + Reagent’s Diluents Sample + Reagent Reagent blank Sample blank Unknown

29
Electrical interference solving
Grounding Stabilizer

30
Electrical interference solving
Bichromatic measurement Dichromatic measurement A Corrected = A1-A2 Absorbance A1 A A A2 1 2 Wavelength (nm) ช่วยทำให้การวัดค่า A correctedได้คงที่ กรณี reference signal เปลี่ยนแปลงไม่มาก
 ช่วยทำให้การวัดค่า A correctedได้คงที่ กรณี reference signal เปลี่ยนแปลงไม่มาก.")
31
Physical interference solving
Dilution for optimum viscosity and absorptivity

32
การตรวจวิเคราะห์ด้วย เครื่องวิเคราะห์สารเคมีอัตโนมัติ
ปัญหา การตรวจวิเคราะห์ด้วย เครื่องวิเคราะห์สารเคมีอัตโนมัติ ที่ใช้หลักการวิเคราะห์แบบ photometry measurement

33
ทฤษฎีการคำนวณ ของ Beer & Lambert Law
กรณีใช้เครื่องวิเคราะห์อัตโนมัติ As AU1 ABk U1 S1 Reference signal S1 - 0 As - ABk Cal Factor = ค่าขณะทำ Calibration ใช้ได้นานเท่าไหร่จึงไม่เปลี่ยน ? ถ้า cuvette ที่ใช้ทำ Blank มีปํญหา ? S1 - 0 As - ABk U1 = (AU1– ABk) x
 x.")
34
Fixed-time for Reading End-point assay
Substrate depletion A log phase DA Lag pahse Time DT Lag time Interval reading Continuous-monitoring assay (Kinetic assay or Rate assay) 1st Read 2nd Read Two-point kinetic assay or Two-point rate assay Fixed-time for Reading End-point assay
 1st Read. 2nd Read. Two-point kinetic assay. or Two-point rate assay. Fixed-time for Reading. End-point assay.")
35
Substrate depletion reaction
6 JULY 2003 ปฏิกิริยาตรวจวัด LDH (Kinetic) มีปริมาณคงที่ LDH L-lactate + NADH Pyruvate + NADH 340 nm A Substrate depletion reaction High Abs limit Initial rate DA/min limit Delta Abs limit blank Lag time Interval reading time Time
 มีปริมาณคงที่ LDH. L-lactate + NADH+ Pyruvate + NADH. 340 nm. A. Substrate depletion reaction. High Abs limit. Initial rate. DA/min limit. Delta Abs limit. blank. Lag time. Interval reading time. Time.")
36
Least squares calculation
L-Alanine + 2-Oxoglutarate ALT Pyruvate + L-Glutamate Pyruvate + NADH LDH L-Lactate + NAD Incubation time A 7 reading at 30 seconds intervals Fast kinetics of DataProTM Least squares calculation 30 45 Correlation coefficient : linear reaction : suspect linearity < : non linear Slope --> DA/min มากกว่า Consumption limit(CL) Time (sec.) Lag time Interval reading time Sample + Reagent(s)
 Time (sec.) Lag time. Interval reading time. Sample + Reagent(s)")
37
ข้อมูลจากเอกสารประกอบน้ำยาตรวจวัด ALT
กรณี ความกว้าง cuvette = 1.0 cm ตั้ง initial rate หรือ consumption limit : 0.26 กรณี ความกว้าง cuvette = 0.5 cm ตั้ง initial rate หรือ consumption limit : 0.13

38
ข้อมูลจากเอกสารประกอบน้ำยาตรวจวัด ALT
0.57 x 450 = mA/min = A/min = 0.26 A/min กรณี ความกว้าง cuvette = 1.0 cm ตั้ง initial rate หรือ consumption limit : 0.26 กรณี ความกว้าง cuvette = 0.5 cm ตั้ง initial rate หรือ consumption limit : 0.13

39
Bilirubin รบกวนการตรวจวัด Creatinine จะแก้ไขอย่างไร
NaOH Creatinine + Picrate Bilirubin ลดอัตราการเกิด complex Non-creatinine substances เพิ่มค่าดูดกลืนแสง = nm กรณีไม่ตกตะกอนโปรทีน น้ำยาควรมี detergent End-point Assay Kinetic Assay R1 (picric acid + NaOH) R1 : NaOH R2 : picric acid) ทำลายสารรบกวนได้ Lag time 60s Read time 60s Lag time 20s Read time 60s
 R1 : NaOH. R2 : picric acid) ทำลายสารรบกวนได้ Lag time 60s Read time 60s. Lag time 20s Read time 60s.")
40
ปัญหาสารรบกวนปฏิกิริยาตรวจวิเคราะห์
Enzyme Co-factor จากสารกันเลือดแข็ง Mg++ Zn++ NaF/K-oxalate tube F- เกาะกับ metal ion ได้ Oxalate เกาะกับ Ca++ รบกวนปฏิกิริยาตรวจ วิเคราะห์ที่ใช้เอนไซม์ Citrate tube เกาะกับ Ca++ EDTA-tube เกาะกับ Ca++ Lithium Heparin-tube Hemolysate serum/plasma Lipimic serum Icteric serum

45
ค่า Target Value ของ Control
กรณีศึกษา 1 ผลการตรวจวัดสารเคมีด้วยเครื่องวิเคราะห์อัตโนมัติที่ใช้หลักการ Photometry ได้ข้อมูลดังนี้ ตัวอย่างตรวจ สารเคมี ผลตรวจ ค่า Target Value ของ Control Sample A ALT AST 5 445 U/L Control Serum Level I 25 Mean = 25 U/L (range 17 – 33) Control Serum Level II 111 171 Mean = 111 U/L (range 94 – 127) Mean = 171 U/L (range 146 – 197) หมายเหตุ: (1) เครื่องวิเคราะห์อัตโนมัติได้รับการบำรุงรักษาตามกำหนด (2) การตรวจวัด ALT และ AST ใช้วิธีวัดแบบ Rate Assay (3) Linearity ของการตรวจวัด ALT และ AST เท่ากับ 450 U/L
 Control Serum Level II Mean = 111 U/L (range 94 – 127) Mean = 171 U/L (range 146 – 197) หมายเหตุ: (1) เครื่องวิเคราะห์อัตโนมัติได้รับการบำรุงรักษาตามกำหนด. (2) การตรวจวัด ALT และ AST ใช้วิธีวัดแบบ Rate Assay. (3) Linearity ของการตรวจวัด ALT และ AST เท่ากับ 450 U/L.")
46
ความเข้มข้นสาร A ในตัวอย่าง (mg/L)
กรณีศึกษาที่ 2 ในการศึกษาการรบกวนของสาร A ต่อการตรวจวัด glucose ได้ปฏิบัติดังนี้ นำ pooled serum มาเตรียมตัวอย่างเพื่อศึกษาดังนี้ Sample1: น้ำกลั่น 0.1 ml + Pooled serum 9.9 ml Sample2: 100 mg/L สาร A 0.1 ml Sample3: 250 mg/L สาร A 0.1 ml Sample4: 500 mg/L สาร A 0.1 ml Sample5: 750 mg/L สาร A 0.1 ml Sample6: 1000 mg/L สาร A 0.1 ml Glucose (mg/L) ความเข้มข้นสาร A ในตัวอย่าง (mg/L) % Interference Sample1: 830 Sample2: 820 Sample3: 800 Sample4: 730 Sample5: 700 Sample6: 640
 ความเข้มข้นสาร A ในตัวอย่าง (mg/L) % Interference. Sample1: 830. Sample2: 820. Sample3: 800. Sample4: 730. Sample5: 700. Sample6: 640.")
47
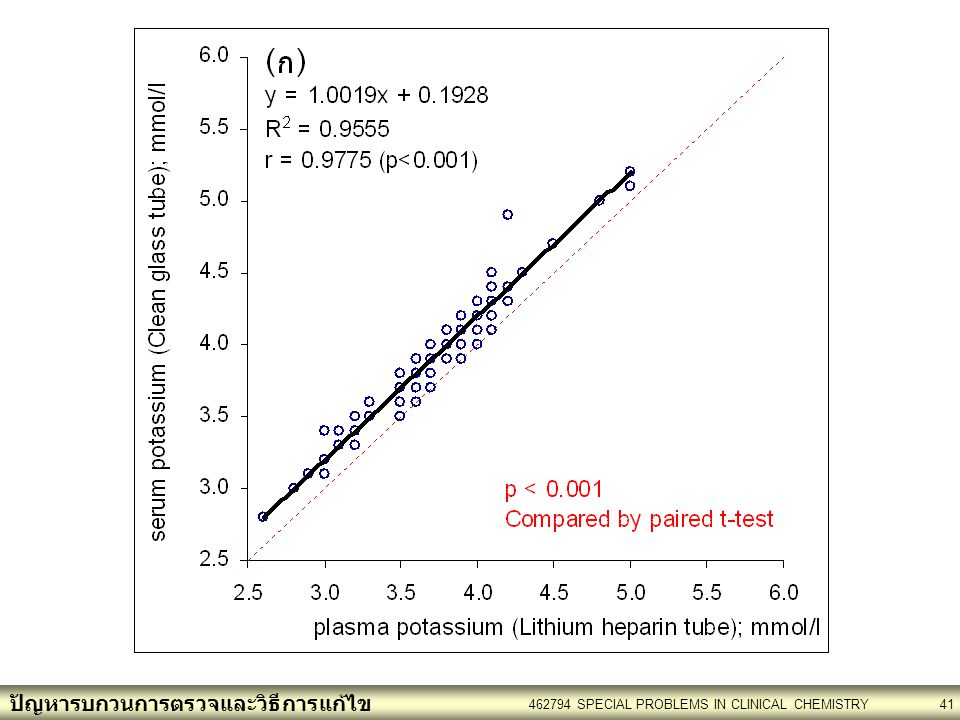
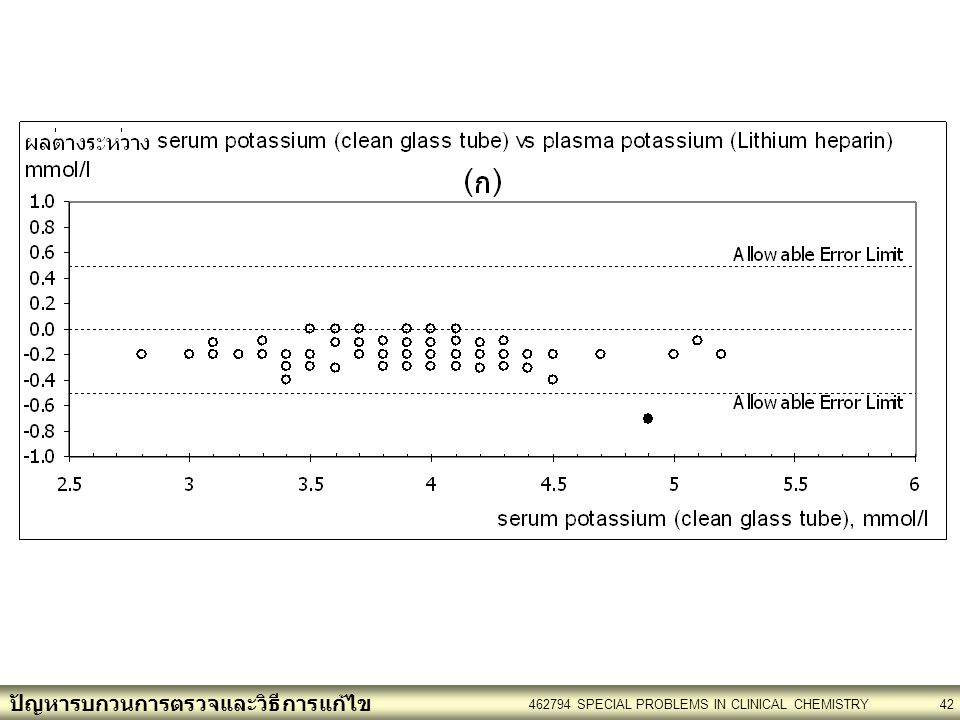
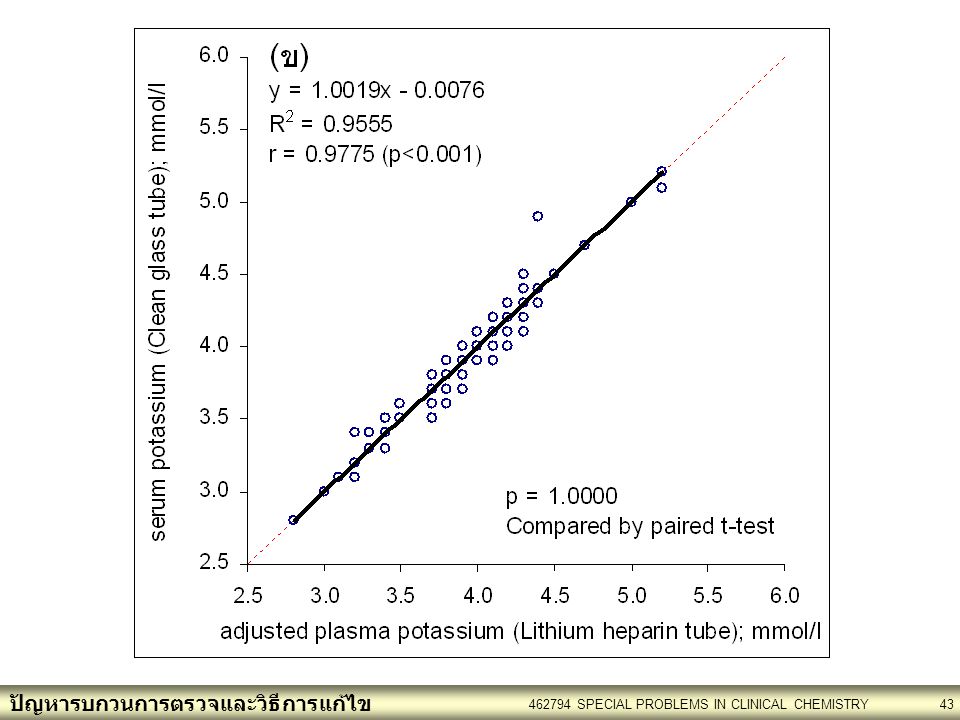
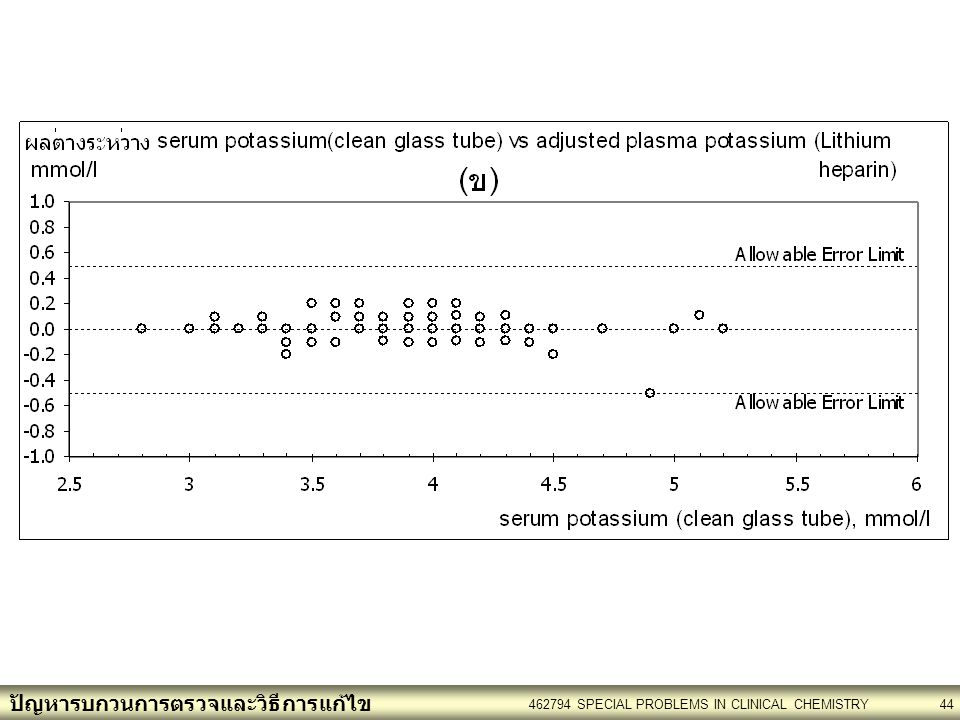
กรณีศึกษาที่ 3 การศึกษาผลของ Lithium heparin ต่อผลการตรวจ Chloride โดยเจาะเก็บเลือดแบ่งใส่หลอด Clot blood (ไม่มีสารกันเลือดแข็ง) และหลอดที่มี lithium heparin ในปริมาณที่เท่ากัน และนำไปปั่นแยก serum และ plasma มาตรวจวัด Chloride พร้อมกัน ได้ผลตรวจ Chloride ดังตาราง ผลตรวจวัด Chloride ใน Serum และ Heparin Plasma no Serum Heparin plasma 1 102 103 31 93 95 61 108 2 107 106 32 96 62 3 100 97 33 110 109 63 4 104 34 105 64 5 101 35 98 65 6 36 66 7 37 67 8 38 68 9 39 69 10 40 70 111 11 41 71 99 12 42 72 13 43 73 14 44 74 15 45 75 16 46 76 17 47 77 18 48 78 19 49 79 20 50 80 21 51 81 22 52 82 23 53 83 24 54 84 25 55 85 26 56 86 27 57 87 28 58 88 29 59 89 30 60 90
 และหลอดที่มี lithium heparin ในปริมาณที่เท่ากัน และนำไปปั่นแยก serum และ plasma มาตรวจวัด Chloride พร้อมกัน ได้ผลตรวจ Chloride ดังตาราง. ผลตรวจวัด Chloride ใน Serum และ Heparin Plasma. no. Serum. Heparin plasma")
48
Miss Ammala Monsouvanh 2) 545090029-6 นางสาวกัญญา ดาวสี 3) 545090030-1
1) Miss Ammala Monsouvanh 2) นางสาวกัญญา ดาวสี 3) นายเจริญฤทธิ์ สัมฤทธิ์ 4) นางสาวพัชราวดี ศรีงาม 5) นายวิจิตร์ โทนศิริ 6) นายวุฒิชัย สุขสนิท 7) นางสาวศิรินทร มาเห็ม 8) นางสุลักขณา วงค์วิเศษ 9) นายอังคาร อนันเต่า ให้ช่วยกันวิเคราะห์ และ ตอบคำถามในแบบฝึกวิเคราะห์ และส่งก่อนวันที่ 24 ก.ค. 2555 วันที่ 24 ก.ค จะเลือกตัวแทนของกลุ่มมานำเสนอผลการวิเคราะห์และตอบคำถาม ผลงานใช้ประกอบการให้คะแนนเก็บในส่วนของ Report
 Miss Ammala Monsouvanh. 2) นางสาวกัญญา ดาวสี 3) นายเจริญฤทธิ์ สัมฤทธิ์ 4) นางสาวพัชราวดี ศรีงาม. 5) นายวิจิตร์ โทนศิริ 6) นายวุฒิชัย สุขสนิท. 7) นางสาวศิรินทร มาเห็ม. 8) นางสุลักขณา วงค์วิเศษ. 9) นายอังคาร อนันเต่า. ให้ช่วยกันวิเคราะห์ และ ตอบคำถามในแบบฝึกวิเคราะห์ และส่งก่อนวันที่ 24 ก.ค วันที่ 24 ก.ค จะเลือกตัวแทนของกลุ่มมานำเสนอผลการวิเคราะห์และตอบคำถาม. ผลงานใช้ประกอบการให้คะแนนเก็บในส่วนของ Report.")
งานนำเสนอที่คล้ายกัน


>")


 98.08% 100.02% จังหวัด.>")


