ดาวน์โหลดงานนำเสนอ
งานนำเสนอกำลังจะดาวน์โหลด โปรดรอ

2
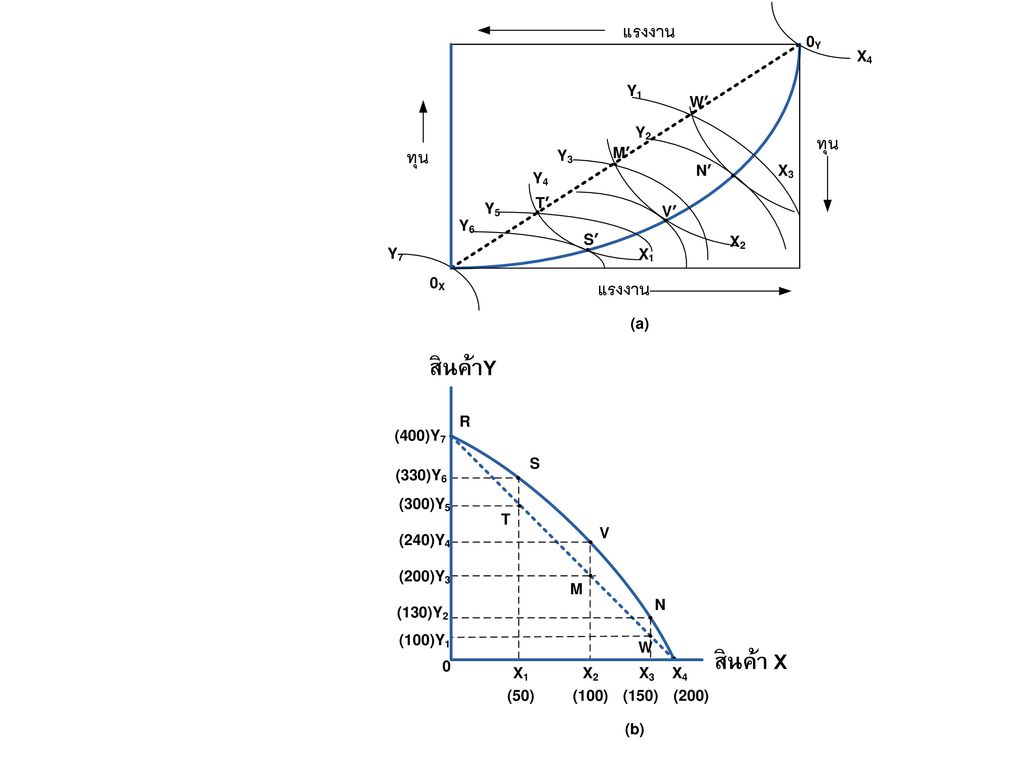
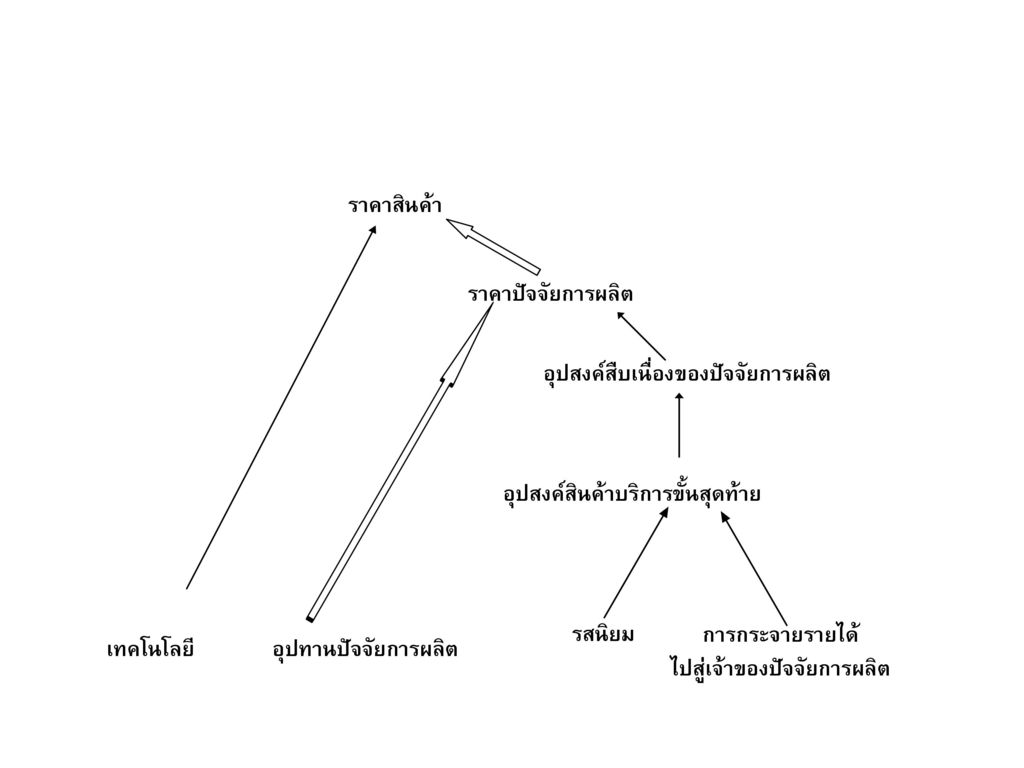
ดุลยภาพผู้ผลิตในตอนที่ไม่มีการค้า (Producer Equilibrium in Autarky)
")
4
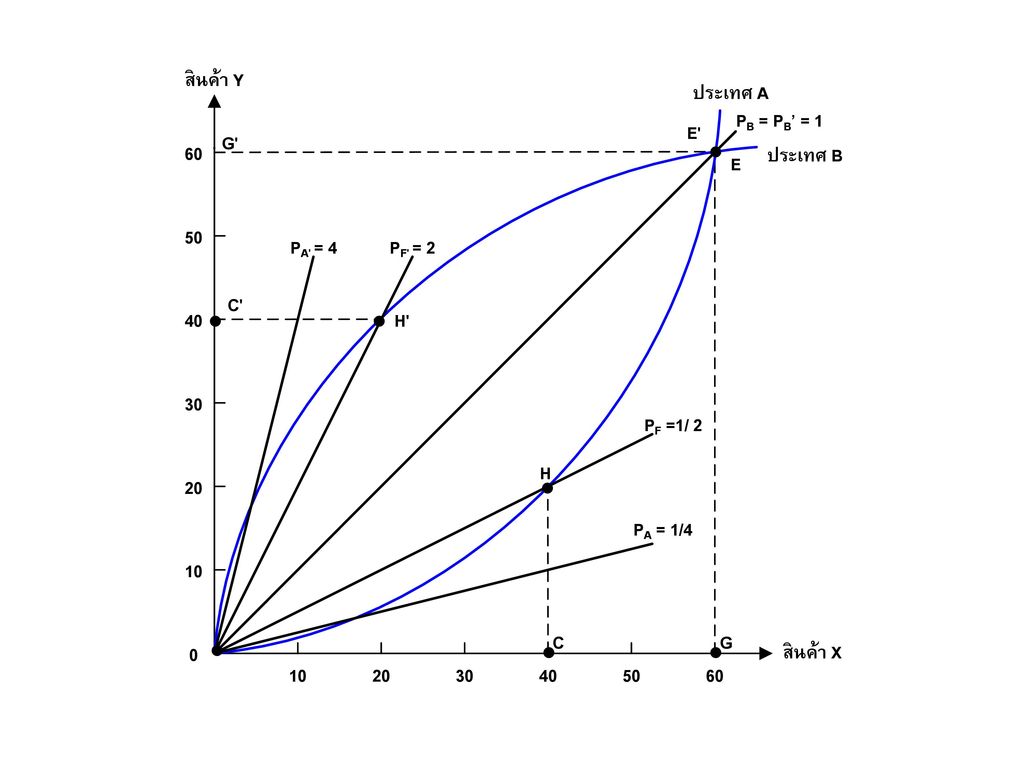
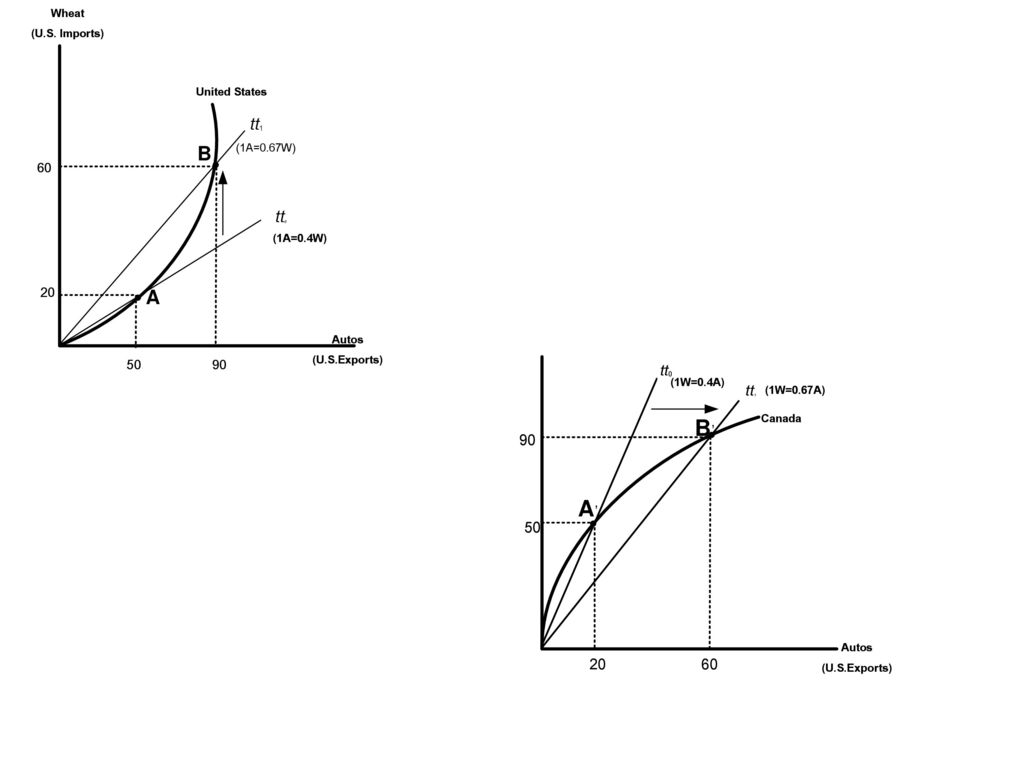
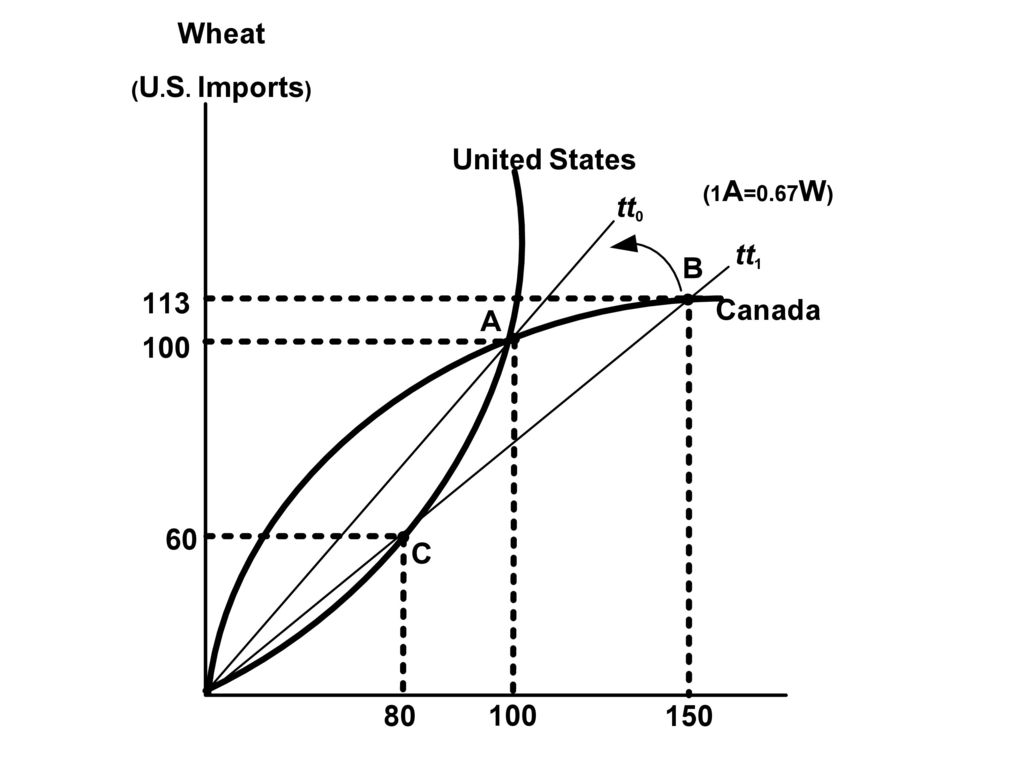
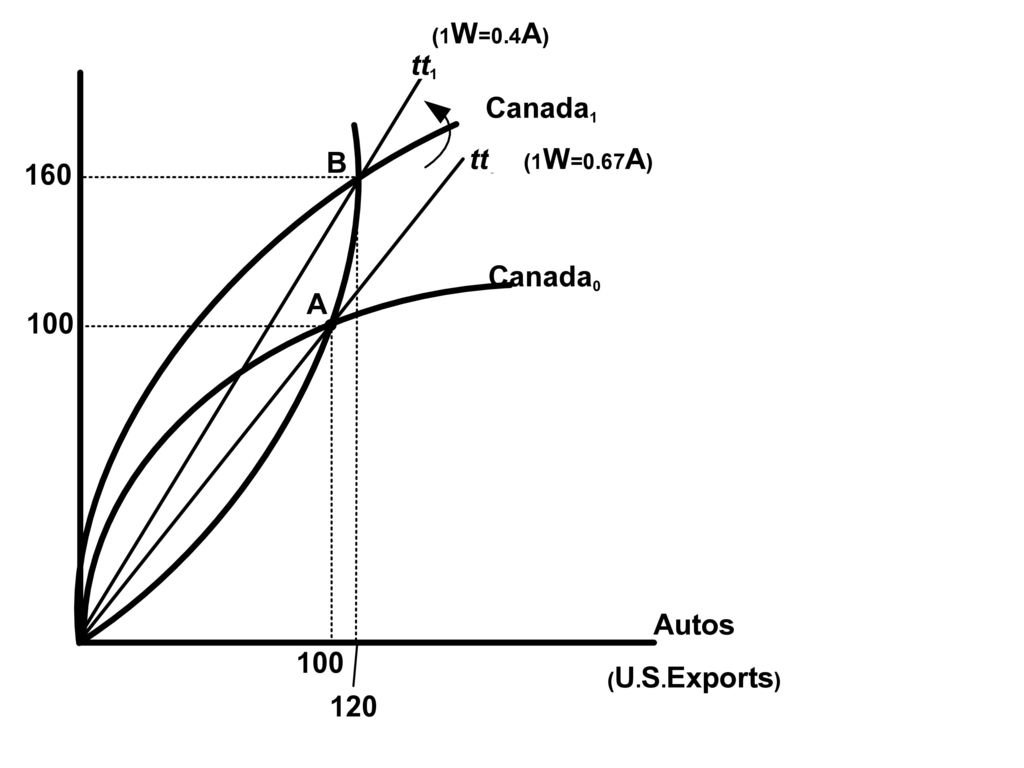
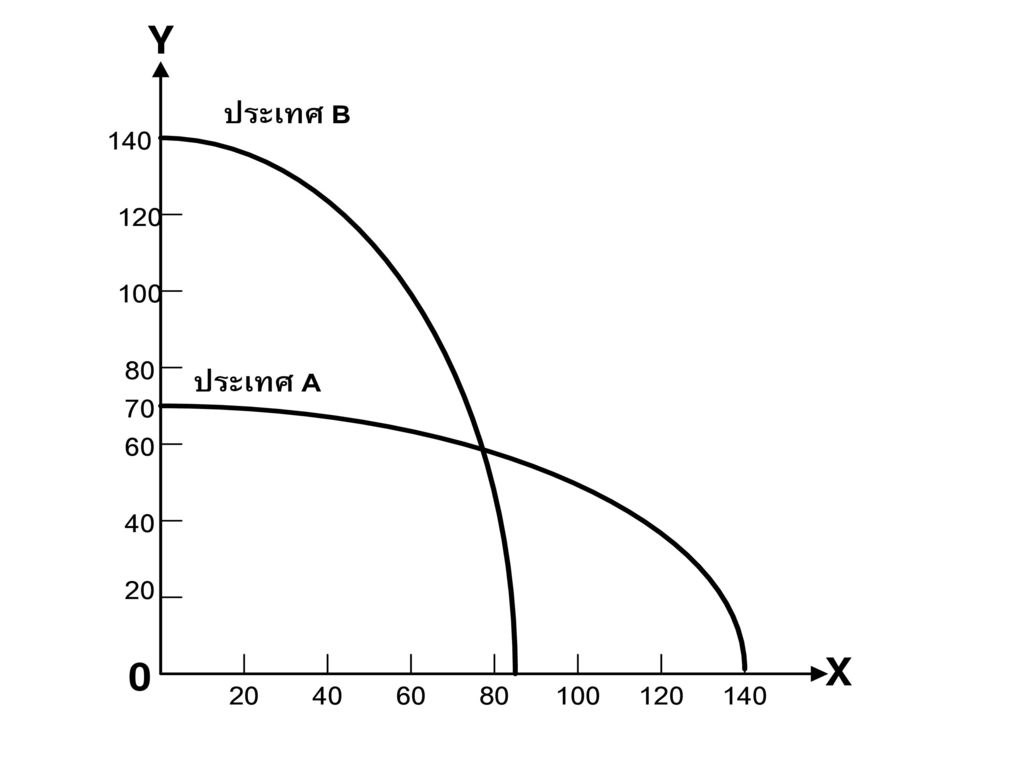
รูปที่ 4.19 พื้นฐานการค้าของประเทศที่มีเส้นเป็นไปได้ในการผลิตเหมือนกันและเงื่อนไขอุปสงค์แตกต่างกัน (The Basis for Trade between Countries with Identical

5
และโครงสร้างการผลิตต่างกัน
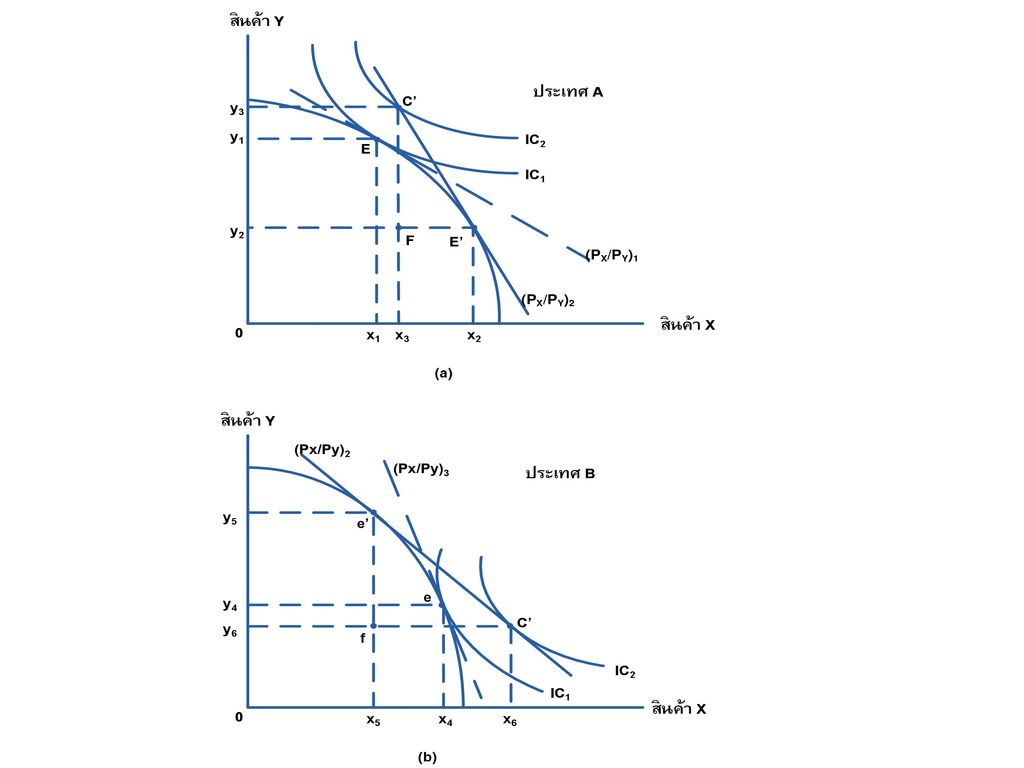
หลักการค้าระหว่างประเทศที่มีเงื่อนไขอุปสงค์เหมือนกัน และโครงสร้างการผลิตต่างกัน

15
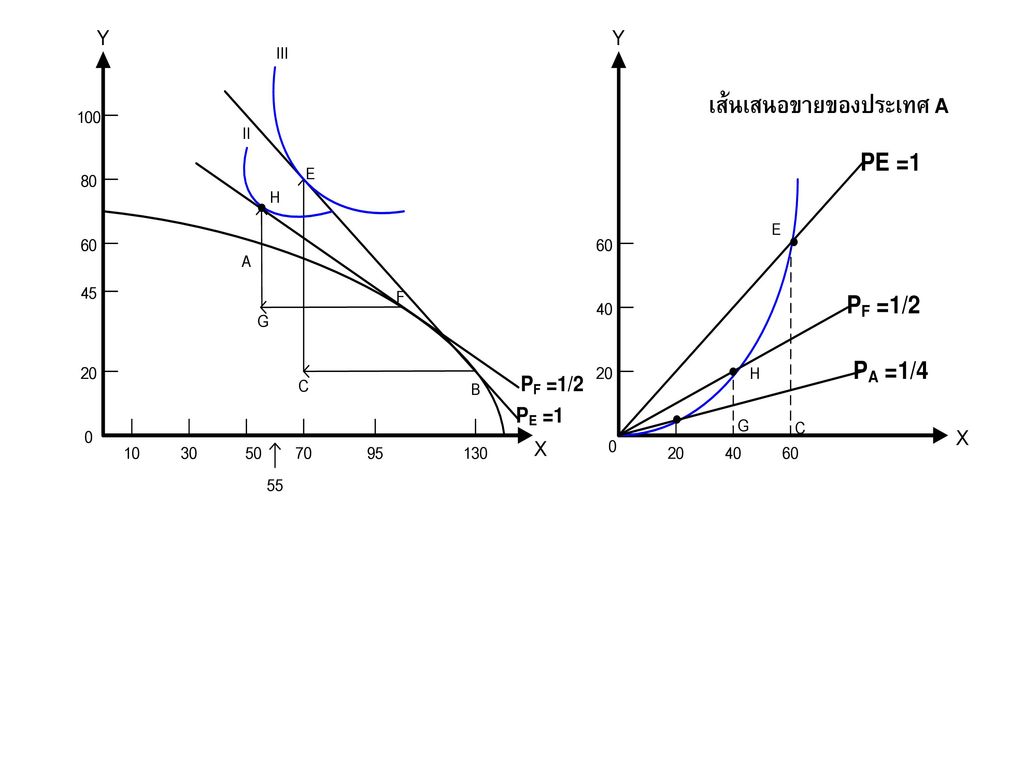
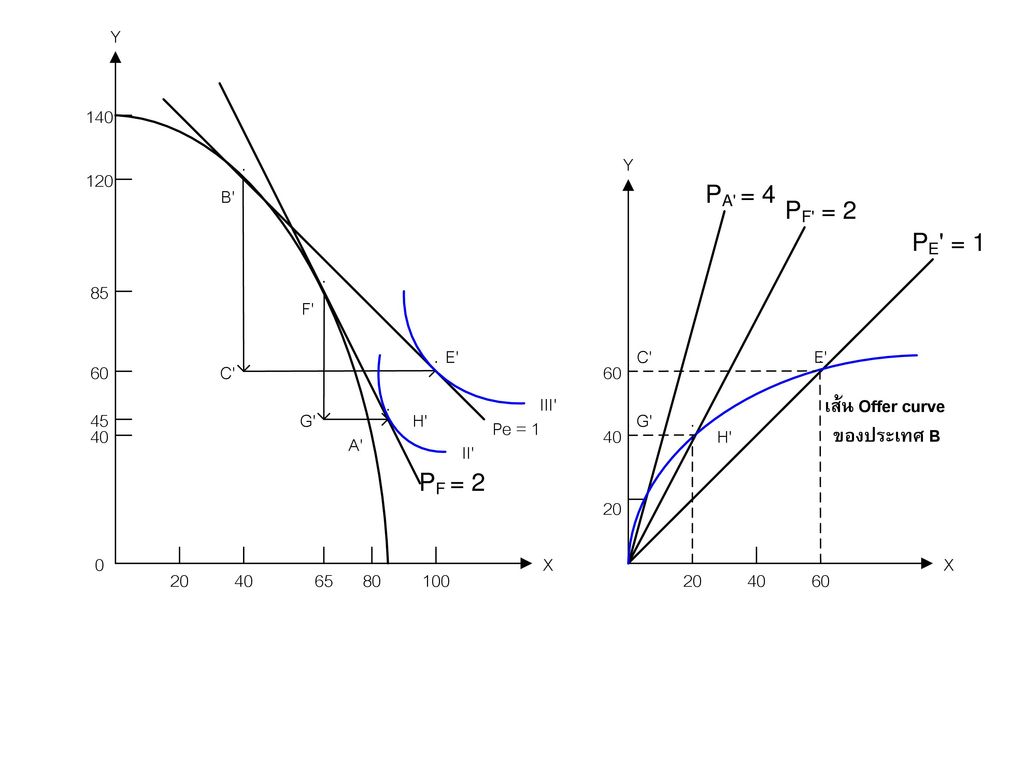
Offer Curves ในรูปที่ 3B.1 เส้น offer curve ของแต่ละประเทศ แสดงถึงจำนวนสินค้า 2 ชนิดที่ต้องการส่งออกและนำเข้า ณ terms of trade ที่แตกต่างกัน ซึ่งแสดงโดย slopes ที่ลากออกจากจุด Offer Curve: refers to the curve’s illustration of the “offer” one country would make for trade with another at any given terms of trade.

16
Appendix 3B.1: Offer Curves for Countries A and B
Imports Exports of Y by A of Y by B (P /P ) tt (P /P ) tt X Y X Y A (P /P ) tt* (P /P ) tt* X Y X Y Y A (P /P ) tt (P /P ) tt X Y 1 X Y 1 Y B B 1 Y B* Y A* Y B Y A 1 A X A X A* X A Exports B X B X B* X B Imports 1 1 of X by A of X by B (a) Trade by A (b) Trade by B
 tt. (P. /P. ) tt. X. Y. X. Y. A. (P. /P. ) tt* (P. /P. ) tt* X. Y. X. Y. Y. A. (P. /P. ) tt. (P. /P. ) tt. X. Y. 1. X. Y. 1. Y. B. B. 1. Y. B* Y. A* Y. B. Y. A. 1. A. X. A. X. A* X. A. Exports. B. X. B. X. B* X. B. Imports of X by A. of X by B. (a) Trade by A. (b) Trade by B.")
17
Offer Curves In Figure 3B.2, at the equilibrium terms of trade, (PX/PY)tt*, the quantity of good X that country A wants to export equals the quantity country B wants to import (and vice versa). At any other terms of trade, there is excess supply of one good and excess demand for the other. The shaded rectangle combines the two countries’ trade triangles from Figure 3.8.
tt*, the quantity of good X that country A wants to export equals the quantity country B wants to import (and vice versa). At any other terms of trade, there is excess supply of one good and excess demand for the other. The shaded rectangle combines the two countries’ trade triangles from Figure 3.8.")
18
3B.2: Equilibrium Terms of Trade
Imports of Y by A, Exports of Y by B Excess demand for Y at ( P /P ) tt X Y (P /P ) tt X Y A Y A (P /P ) tt X Y 1 B Y B Excess supply of X at (P /P ) tt X Y X B X A X B Exports of X by A, 1 Imports of X by B
 tt. X. Y. (P. /P. ) tt. X. Y. A. Y. A. (P. /P. ) tt. X. Y. 1. B. Y. B. Excess supply of. X at. (P. /P. ) tt. X. Y. X. B. X. A. X. B. Exports of X by A, 1. Imports of X by B.")
19
3B.2: Equilibrium Terms of Trade
Imports of Y by A, Exports of Y by B (P /P ) tt X Y 1 Y B B 1 Excess supply of Y at (P /P ) tt X Y 1 Y A 1 X A X B Exports of X by A, 1 1 Imports of X by B Excess demand for X at (P /P ) tt X Y 1
 tt. X. Y. 1. Y. B. B. 1. Excess supply of. Y at. (P. /P. ) tt. X. Y. 1. Y. A. 1. X. A. X. B. Exports of X by A, Imports of X by B. Excess demand for. X at. (P. /P. ) tt. X. Y. 1.")
20
3B.2: Equilibrium Terms of Trade
Imports of Y by A, Exports of Y by B Excess demand for Y at ( P /P ) tt X Y (P /P ) tt X Y A (P /P ) tt* X Y Y A (P /P ) tt X Y 1 B Y B 1 Y A* = Y B* Excess supply of Y at (P /P ) tt Y B X Y 1 Excess supply of Y A 1 X at (P /P ) tt X Y X B X A X A X B Exports of X by A, 1 1 Imports of X by B X A* = X B* Excess demand for X at (P /P ) tt X Y 1
 tt. X. Y. (P. /P. ) tt. X. Y. A. (P. /P. ) tt* X. Y. Y. A. (P. /P. ) tt. X. Y. 1. B. Y. B. 1. Y. A* = Y. B* Excess supply of. Y at. (P. /P. ) tt. Y. B. X. Y. 1. Excess supply of. Y. A. 1. X at. (P. /P. ) tt. X. Y. X. B. X. A. X. A. X. B. Exports of X by A, Imports of X by B. X. A* = X. B* Excess demand for. X at. (P. /P. ) tt. X. Y. 1.")
21
ประเทศ Export Price Index Import Price Index Terms of Trade Greece
ตารางแสดง Commodity Terms of Trade, 1999 (1995 = 100) ประเทศ Export Price Index Import Price Index Terms of Trade Greece Switzerland Canada United Kingdom Australia United States Japan Germany 114 76 101 89 86 96 92 108 73 98 87 99 93 106 104 103 102 100 97 Source : International Monetary Fund, IMF Financial Statistics, Washington, DC, November 2001.
 ประเทศ. Export Price Index. Import Price Index. Terms of Trade. Greece. Switzerland. Canada. United Kingdom. Australia. United States. Japan. Germany Source : International Monetary Fund, IMF Financial Statistics, Washington, DC, November")
22
Oil–Exporting Countries
The Commodity Terms of Trade : การเปลี่ยนแปลงในรูปร้อยละ ปี Industrial Countries Oil–Exporting Countries Developing Countries (average) 1993 1995 1997 1999 2000 1.1 2.0 0.4 -0.6 0.1 -2.7 -7.5 -7.7 6.1 31.2 41.9 -0.7 2.1 -0.9 -0.3 -2.5 Source : International Monetary Fund, IMF Financial Statistics, Washington D.C.,October 2001.
 Source : International Monetary Fund, IMF Financial Statistics, Washington D.C.,October")
23
บทที่ 6

29
ราคาสินค้า ค่าจ้าง อัตราค่าเช่า (Px/Py)1 < (Px/Py)2 W1< W2
ตารางที่ 7.1 ความเท่าเทียมกันของราคาปัจจัยการผลิต ก่อนการค้า ผลกระทบของการค้า การค้าเสรี ประเทศA (แรงงานมาก) ราคาสินค้า ค่าจ้าง อัตราค่าเช่า (Px/Py)1 < (Px/Py)2 W1< W2 r1 > r2 (Px/Py)1 WAa rA (Px/Py)tt W1 = W2 r1 = r2 ประเทศB (ทุนมาก) (Px/Py)2 > (Px/Py)1 W2 > W1 r2 < r1 (Px/Py)2 W1 r1 W2 = W1 r2 = r1
 ราคาสินค้า. ค่าจ้าง. อัตราค่าเช่า. (Px/Py)1 < (Px/Py)2. W1< W2. r1 > r2. (Px/Py)1 WAa. rA (Px/Py)tt. W1 = W2. r1 = r2. ประเทศB (ทุนมาก) (Px/Py)2 > (Px/Py)1. W2 > W1. r2 < r1. (Px/Py)2 W1 r1 W2 = W1. r2 = r1.")
31
Demand revesrsal

32
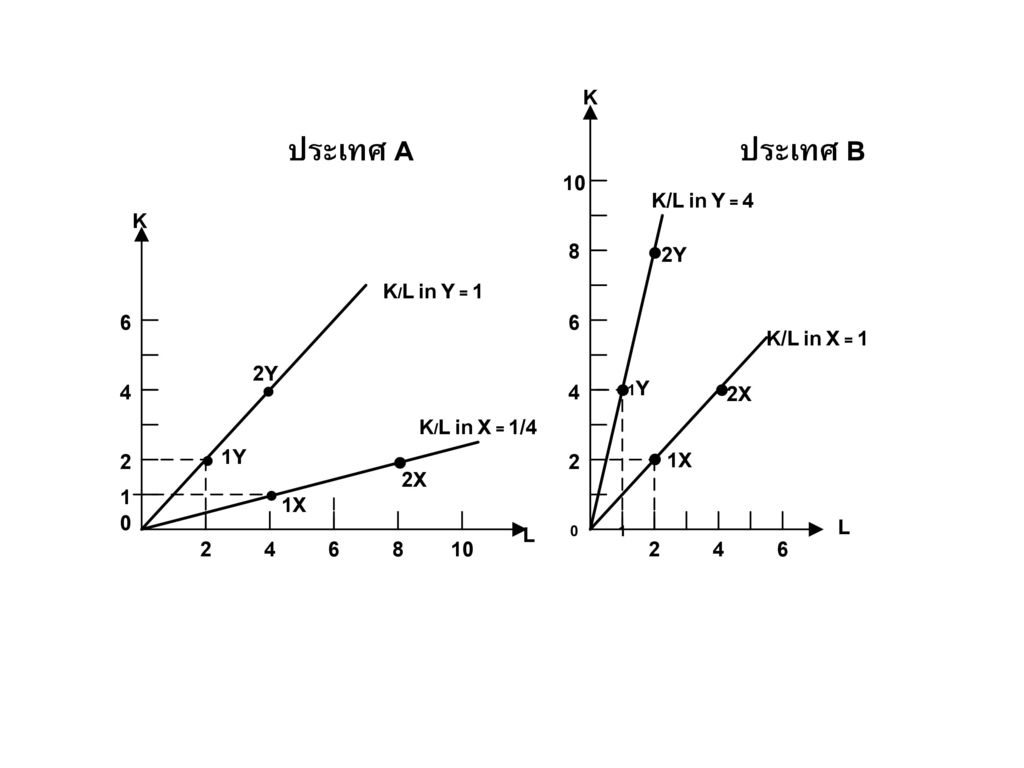
รูปที่ 7.7 การพลิกผันของความเข้มข้นการใช้ปัจจัยการผลิต

งานนำเสนอที่คล้ายกัน

 มีเนื้อหา ครอบคลุม ทางด้าน การเงินธุรกิจ International Financial Statistics.>")


 ดร.วิธาดา อนกูลวรรธกะ>")
 ดร.วิธาดา อนกูลวรรธกะ>")


