ดาวน์โหลดงานนำเสนอ
งานนำเสนอกำลังจะดาวน์โหลด โปรดรอ

1
น.ท.หญิง วัชราพร เชยสุวรรณ
t-test น.ท.หญิง วัชราพร เชยสุวรรณ

2
Steps of hypothesis testing
1. State the null (H0) and alternative (Ha) hypotheses. 2. Decide on the significance level (α) 3. Compute the value of the test statistic. 4. Decision to accept or reject H0 If p-value(Sig.) α, then reject H0; otherwise, not reject H0 5. State the conclusion in words.
 and alternative (Ha) hypotheses. 2. Decide on the significance level (α) 3. Compute the value of the test statistic. 4. Decision to accept or reject H0. If p-value(Sig.) α, then reject H0; otherwise, not reject H0. 5. State the conclusion in words.")
3
ข้อตกลงเบื้องต้น Assumptions
Normal distribution: ข้อมูลต้องมาจากประชากรที่มีการแจกแจงเป็นโค้งปกติ Analyze Descriptive Stat. Explore ตัวแปร เป็น interval or ratio scale There are exceptions, and some of these assumptions can be violated: Assump. 1 can be violated if large sample size present If assump. 3 is violated, the ANOVA’s F value gives an inaccurate p-value.

4
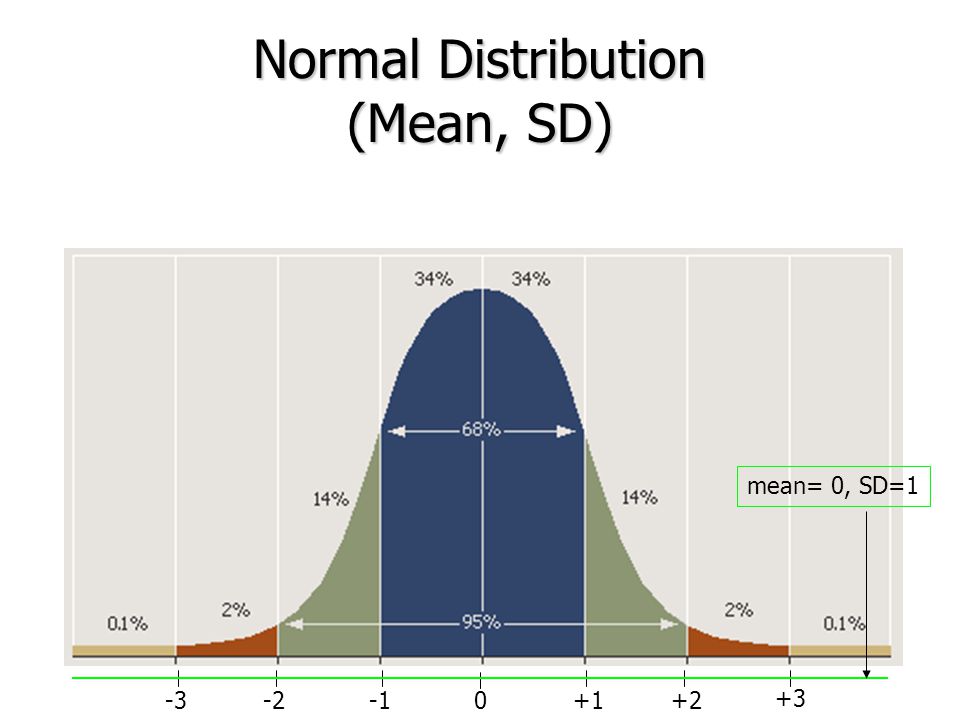
Normal Distribution (Mean, SD)
-3 -2 -1 +1 +2 +3
5
Characteristics of Hypothesis Test for t-test
Hypothesis Test for One Population Mean (1 group) 2. Hypothesis Test for Two Population Means (2 groups) 2.1 Using Independent groups - Variances Assumed Equal - Variances Not Assumed Equal 2.2 Using Paired (Dependent) groups
 2. Hypothesis Test for Two Population Means (2 groups) 2.1 Using Independent groups. - Variances Assumed Equal. - Variances Not Assumed Equal. 2.2 Using Paired (Dependent) groups.")
6
t - test 2 GROUP dependent gr. independent gr. equal var. unequal var.

7
Hypothesis Test for One Population Mean (1 group)
Null hypothesis: Alternative hypothesis: H0 : µ µ0 Ha : µ ≠ µ0 H0 : µ ≥ µ0 Ha : µ µ0 H0 : µ ≤ µ0 Ha : µ µ0 µ0 : constant

8
t-test for One Population Mean
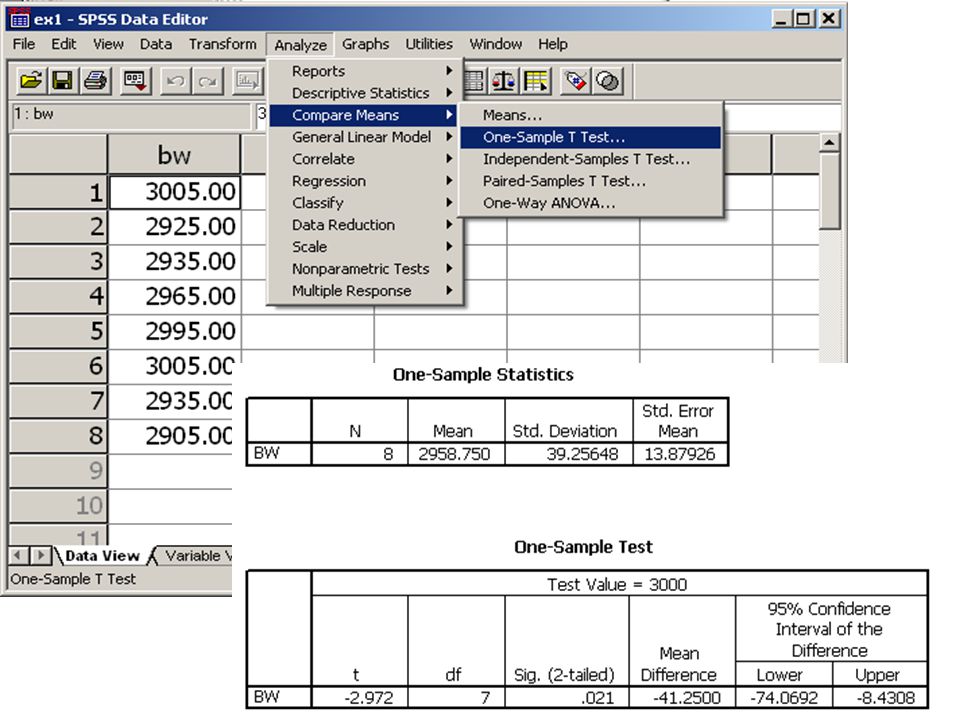
SPSS: Analyze > Compare Means > One-Sample T Test…

9
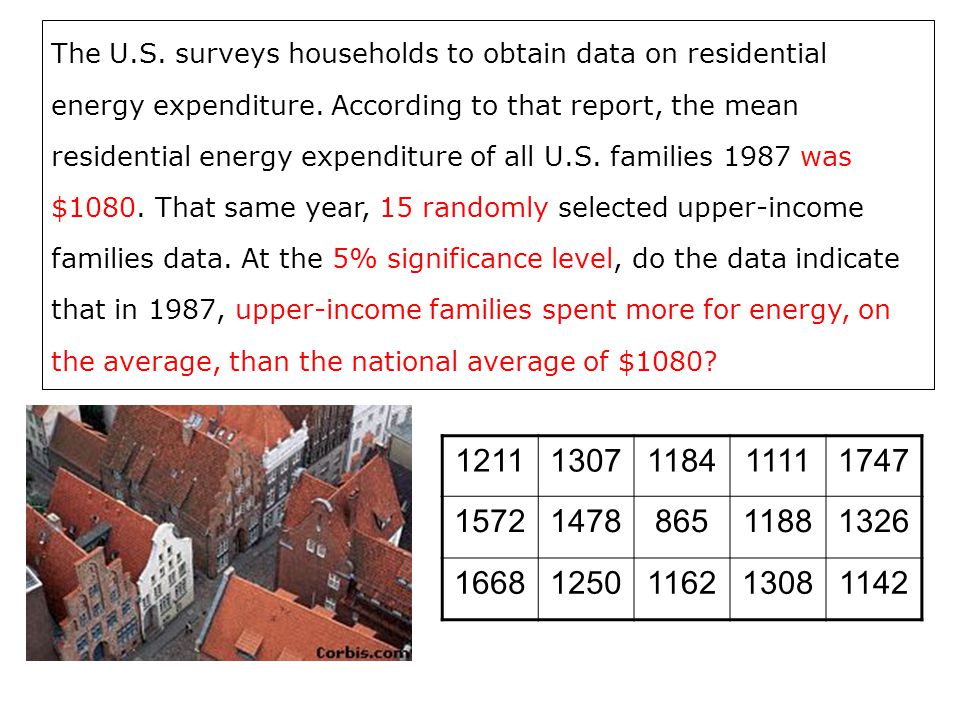
The U.S. surveys households to obtain data on residential energy expenditure. According to that report, the mean residential energy expenditure of all U.S. families 1987 was $1080. That same year, 15 randomly selected upper-income families data. At the 5% significance level, do the data indicate that in 1987, upper-income families spent more for energy, on the average, than the national average of $1080? 1211 1307 1184 1111 1747 1572 1478 865 1188 1326 1668 1250 1162 1308 1142
10
α = .05 1. The hypotheses are 2. The significant level
Ha : µ 1080 $ 2. The significant level α = .05 3. Statistic test SPSS: Analyze > Compare Means > One-Sample T Test…

11
SPSS: Analyze > Compare Means > One-Sample T Test…

12
1 2

13
interpretation 1 2 จำนวนครัวเรือนที่สำรวจ 15 ครัวเรือน
จำนวนครัวเรือนที่สำรวจ ครัวเรือน ค่าใช้จ่ายเฉลี่ยต่อครัวเรือน $ ส่วนเบี่ยงเบนมาตรฐาน 1 ค่า t ที่คำนวณ มีค่า 3.710 ค่า p แบบทิศทางเดียว .002/2 = ค่า α .05 ดังนั้น ปฏิเสธ Ho 2

14
p-value (.001) < (.05) , then reject Ho
4. Decision to accept or reject Ho p-value (.001) < (.05) , then reject Ho 5. Conclusion Upper-income families spent more for energy than the national average of $1080 at significance level .05
 < (.05) , then reject Ho. 5. Conclusion. Upper-income families spent more for energy than the national average of $1080 at significance level .05.")
15
น้ำหนักทารกแรกเกิดปกติทั่วไปมีน้ำหนักเฉลี่ยมาตรฐาน 3000 กรัม นักโภชนาการต้องการทราบว่าน้ำหนักทารกแรกเกิดเฉลี่ยของจังหวัดปทุมธานีต่างจากค่าเฉลี่ยมาตรฐานหรือไม่ จึงสุ่มทารกแรกเกิดของจังหวัดปทุมธานี จำนวน 8 คน น้ำหนัก (กรัม) 3,005 2,995 2,925 2,935 2,965 2,905
 3,005. 2,995. 2,925. 2,935. 2,965. 2,905.")
17
ค่า p < ค่า α ดังนั้น reject Ho
a. The hypotheses are H0 : µ = 3000 (น้ำหนักทารกแรกเกิดมีน้ำหนักเฉลี่ยเท่ากับ 3000 กรัม) Ha : µ ≠ 3000 (น้ำหนักทารกแรกเกิดมีน้ำหนักเฉลี่ยไม่เท่ากับ 3000 กรัม) b. The significant level α = .05 c. Statistic test mean = , SD=39.26 t= , p=.021 d. Decision to accept or reject H0 ค่า p < ค่า α ดังนั้น reject Ho e. Conclusion น้ำหนักทารกแรกเกิดเฉลี่ยของจังหวัดปทุมธานีไม่เท่ากับ 3000 กรัม ที่ระดับนัยสำคัญ .05
 Ha : µ ≠ 3000 (น้ำหนักทารกแรกเกิดมีน้ำหนักเฉลี่ยไม่เท่ากับ 3000 กรัม) b. The significant level. α = .05. c. Statistic test. mean = , SD= t= , p=.021. d. Decision to accept or reject H0. ค่า p < ค่า α ดังนั้น reject Ho. e. Conclusion. น้ำหนักทารกแรกเกิดเฉลี่ยของจังหวัดปทุมธานีไม่เท่ากับ 3000 กรัม ที่ระดับนัยสำคัญ .05.")
18
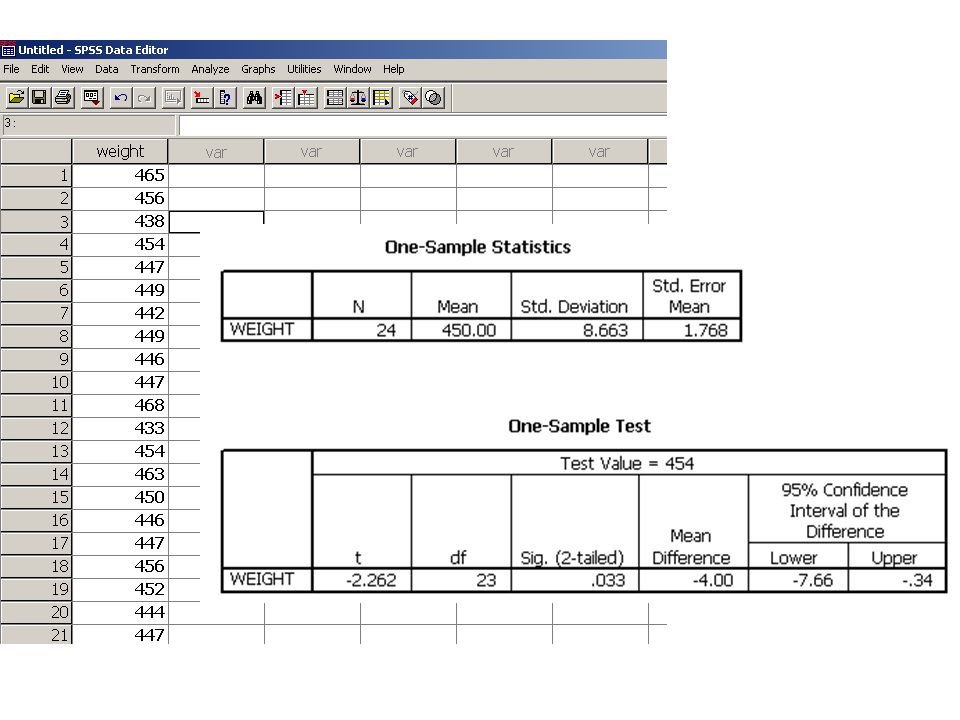
A company that produces snack foods uses a machine to package 454 gram bags of pretzels. To check whether the machine is working properly, the quality-assurance department takes a random sample of 24 bags of pretzels. The net weights ,in grams, of the 24 bags of pretzels are displayed here 465 456 438 454 447 449 442 446 468 433 463 450 452 444 435 Do the data provide sufficient evidence to conclude that the packaging machine is not working properly?

20
ค่า p < ค่า α ดังนั้น reject Ho
a. The hypotheses are H0 : µ = 454 grams (the machine is working properly) Ha : µ ≠ 454 grams (the machine is not working properly) b. The significant level α = .05 c. Statistic test mean = , SD=8.66 t= , p=.033 d. Decision to accept or reject H0 ค่า p < ค่า α ดังนั้น reject Ho e. Conclusion เครื่องจักรทำงานไม่เหมาะสม บรรจุขนมต่อถุงไม่เท่ากับ 454 กรัม ที่ระดับนัยสำคัญ .05
 Ha : µ ≠ 454 grams (the machine is not working properly) b. The significant level. α = .05. c. Statistic test. mean = , SD=8.66. t= , p=.033. d. Decision to accept or reject H0. ค่า p < ค่า α ดังนั้น reject Ho. e. Conclusion. เครื่องจักรทำงานไม่เหมาะสม บรรจุขนมต่อถุงไม่เท่ากับ 454 กรัม ที่ระดับนัยสำคัญ .05.")
21
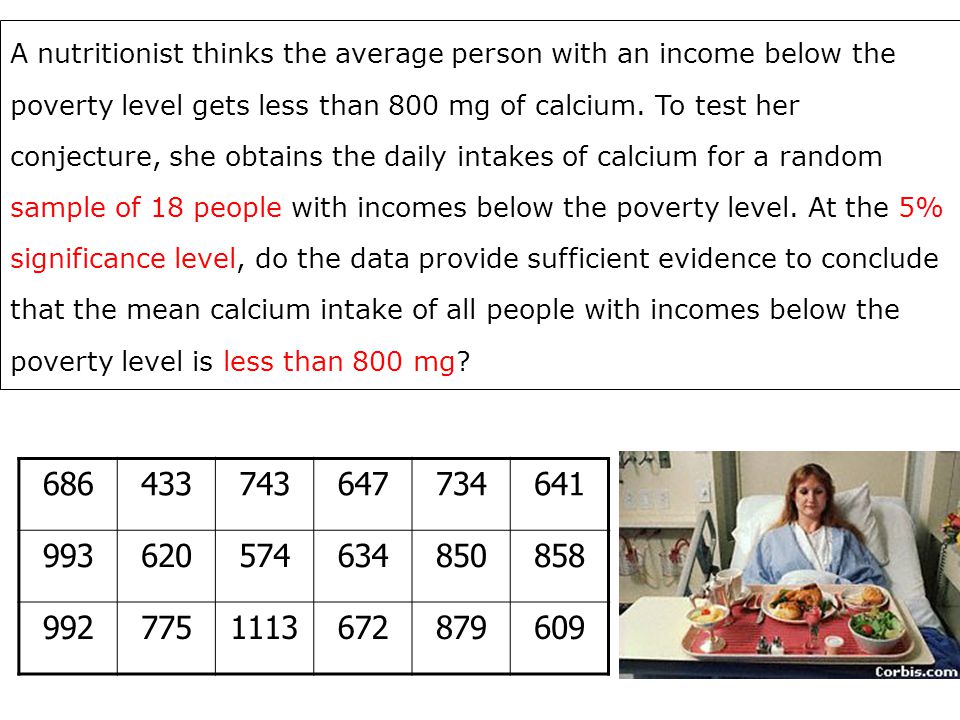
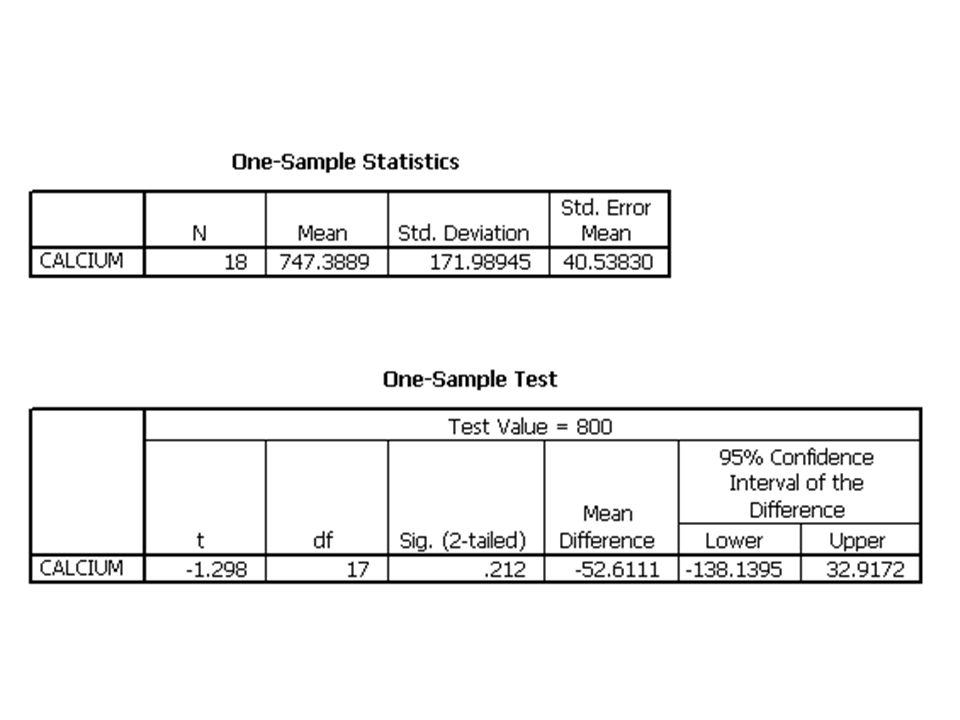
A nutritionist thinks the average person with an income below the poverty level gets less than 800 mg of calcium. To test her conjecture, she obtains the daily intakes of calcium for a random sample of 18 people with incomes below the poverty level. At the 5% significance level, do the data provide sufficient evidence to conclude that the mean calcium intake of all people with incomes below the poverty level is less than 800 mg? 686 433 743 647 734 641 993 620 574 634 850 858 992 775 1113 672 879 609
23
ค่า p > ค่า α ดังนั้น not reject Ho
a. The hypotheses are H0 : µ 800 mg Ha : µ 800 mg b. The significant level α = .05 c. Statistic test mean = , SD=171.99 t= , p= .212/2 =.106 d. Decision to accept or reject H0 ค่า p > ค่า α ดังนั้น not reject Ho e. Conclusion The mean calcium intake of the poverty people is not less than 800 mg at the .05 significance level

24
t - test 1 GROUP dependent gr. independent gr. equal SD. unequal SD.

25
Hypothesis Test for Two Population Means
Null hypothesis: Alterative hypothesis: H0 : µ1 = µ2 H1 : µ1 ≠ µ2 H0 : µ1 ≥ µ2 H1 : µ1 < µ2 H0 : µ1 ≤ µ2 H1 : µ1 > µ2

26
t - test 1 GROUP 2 GROUP dependent gr. independent gr. equal SD.
unequal SD.

27
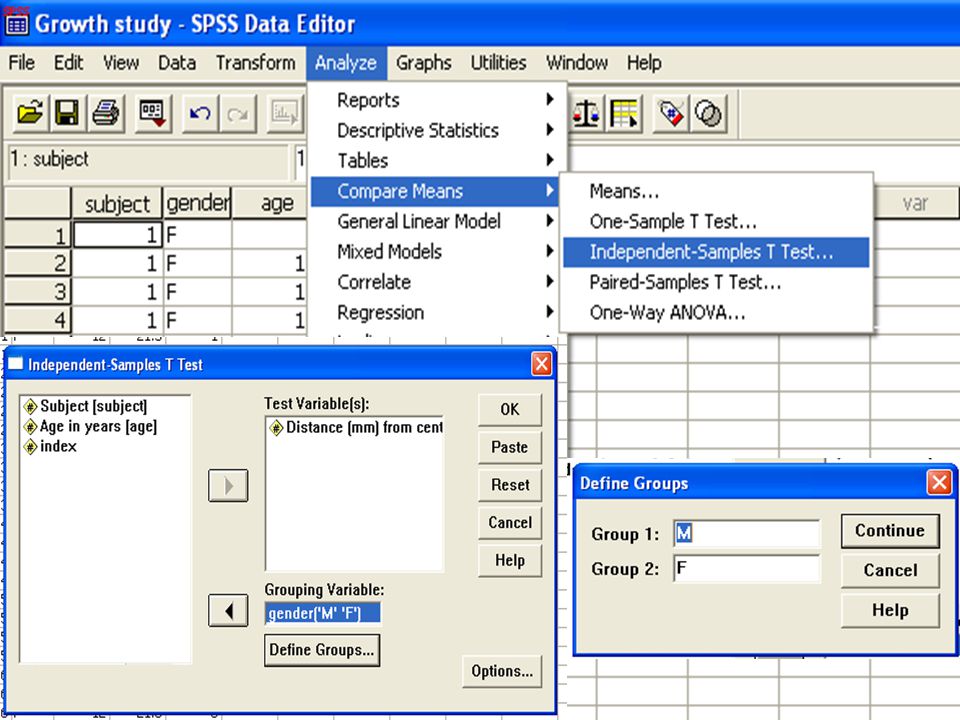
t-test for Two Population Means (independent)
If standard deviations assumed equal If standard deviations not assumed equal SPSS: Analyze>Compare Means>Independent-Samples T Test…

29
α = .05 H0 : µ1 = µ2 Ha : µ1 µ2 a. The hypotheses are
b. The significant level α = .05 c. Statistic test

30
1. การทดสอบ Levene test for Equality Ho : Ha :
2 ค่า F ที่คำนวณ มีค่า 0.236 ค่า p แบบสองทิศทาง = ค่า α.05 ดังนั้น not reject Ho จึงใช้ ค่า t แถว equal variances assumed

31
ค่า p < ค่า α ดังนั้น reject Ho
c. Statistic test 2 t= 4.377, p= .000 d. Decision to accept or reject H0 ค่า p < ค่า α ดังนั้น reject Ho e. Conclusion เพศต่างกันมีลักษณะการเจริญเติบโตแตกต่างกัน อย่างมีนัยสำคัญที่ระดับ .05

32
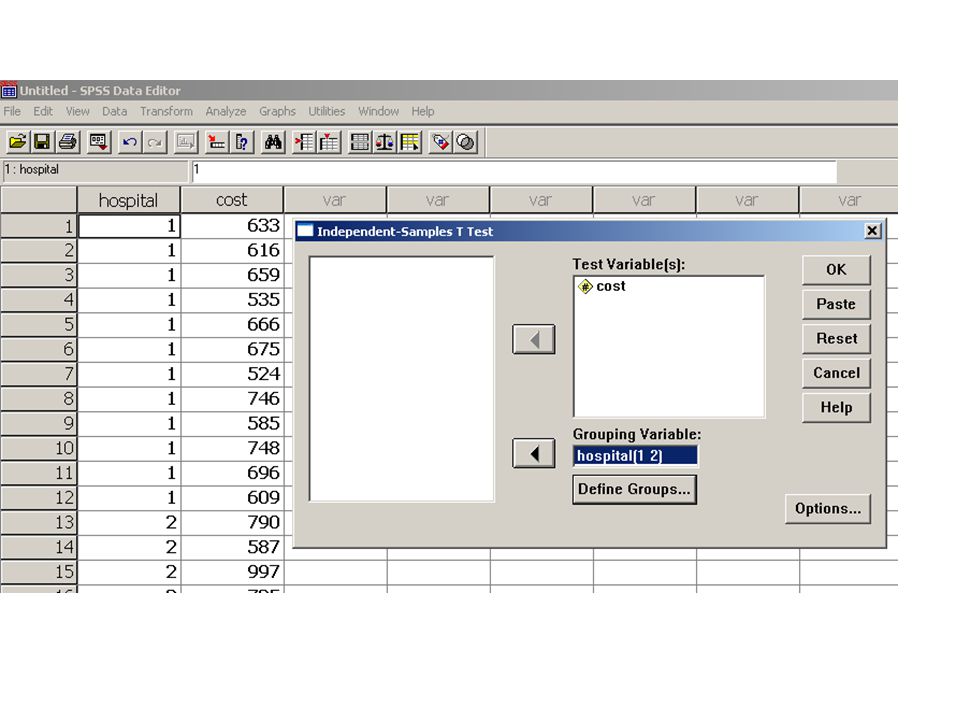
Public hospital Private hospital 633 616 659 535 790 587 997 735 852
Samples of costs($) to public and private hospitals per patient/day Public hospital Private hospital 633 616 659 535 790 587 997 735 852 666 675 524 746 686 839 545 724 554 585 748 696 609 889 797 722 483 579
 to public and private hospitals per patient/day. Public hospital. Private hospital")
34
ค่า p แบบสองทิศทาง = .031 < ค่า α.05
การทดสอบ Levene test for Equality Ho : Ha : ค่า F ที่คำนวณ มีค่า ค่า p แบบสองทิศทาง = < ค่า α.05 ดังนั้น reject Ho จึงใช้ ค่า t แถว equal variances not assumed

35
ค่า p < ค่า α ดังนั้น reject Ho
a. The hypotheses are H0 : µ1 µ2 µ1 = public hospital Ha : µ1 µ µ2 = private hospital b. The significant level α = .05 c. Statistic test t= , p= .087/2=.043 d. Decision to accept or reject H0 ค่า p < ค่า α ดังนั้น reject Ho e. Conclusion ค่าใช้จ่ายเฉลี่ยต่อวันของโรงพยาบาลรัฐบาลน้อยกว่าโรงพยาบาลเอกชนอย่างมีนัยสำคัญทางสถิติที่ระดับ .05

36
t - test 1 GROUP 2 GROUP dependent gr. independent gr. equal SD.
unequal SD.

37
ค่าเฉลี่ย 2 กลุ่ม ไม่เป็นอิสระกัน หรือมีความสัมพันธ์กัน
ค่าเฉลี่ย 2 กลุ่ม ไม่เป็นอิสระกัน หรือมีความสัมพันธ์กัน 1. ประชากร 1 กลุ่ม เก็บข้อมูล 2 ครั้ง : repeated measure : การทดสอบ pre test – post test : เปรียบเทียบผลก่อนและหลังการทดลอง 2. ประชากร 2 กลุ่ม ที่มีลักษณะบางประการเหมือนกันเป็นคู่ๆ / เป็นคู่ที่มีลักษณะสัมพันธ์กัน : สามีภรรยา คู่แฝด match paired design

38
t-test for Two Population Means (dependent)
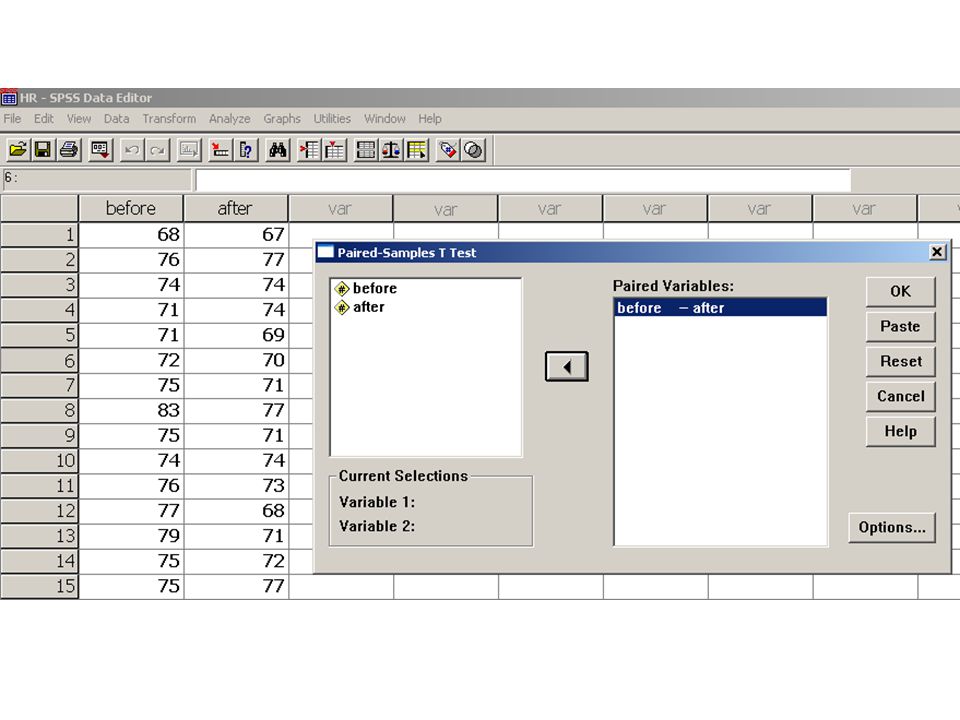
; d = x1-x2 SPSS: Analyze > Compare Means > Paired-Samples T Test…

39
EX. An exercise physiologist wants to determine whether a certain type of running program will reduce heart rates. He measures the heart rates of 15 randomly selected people who are then placed on the running program. One year later he again measures the heart rates of them. The heart rates, both before and after the running program,are displayed here. Person Before After 1 68 67 2 76 77 3 74 4 71 5 69 6 72 70 7 75 8 83 Person Before After 9 75 71 10 74 11 76 73 12 77 68 13 79 14 72 15

40
Ha : α = .05 H0 : a. The hypotheses are b. The significant level
c. Statistic test

43
t = 2.686 , p = .018/2 = .009 ค่า p < ค่า α.05 , reject Ho
c. Statistic test t = , p = .018/2 = .009 d. Decision to accept or reject H0 ค่า p < ค่า α.05 , reject Ho e. Conclusion The running program will reduce heart rates at the .05 significance level

44
Hypothesis Test Conclusion t-test
Reject null hypothesis H0 Ha : µ1 ≠ µ2 Sig.(2-tailed) < α Ha : µ1 > µ2 Sig.(2-tailed) <α , t >0 2 Ha : µ1 < µ2 Sig.(2-tailed)<α , t <
 < α. Ha : µ1 > µ2. Sig.(2-tailed) <α , t >0. 2. Ha : µ1 < µ2. Sig.(2-tailed)<α , t <0 2.")
งานนำเสนอที่คล้ายกัน

 ในช่วงยุค Internet เพิ่ง เริ่มต้น เป็นบริษัทที่ดำเนินงานทางด้าน.>")


 3 วิธี 1. Distribution.>")


