ดาวน์โหลดงานนำเสนอ
งานนำเสนอกำลังจะดาวน์โหลด โปรดรอ

1
สถานภาพการค้าผักของโลก รศ.ดร.กมล เลิศรัตน์
สถานภาพการค้าผักของโลก รศ.ดร.กมล เลิศรัตน์ โลกาภิวัตน์ ผลกระทบต่อผู้ผลิตและการบริโภคผัก การค้าผักโลก...ผู้เล่นหลัก เมื่อมังกรขยับ...สู่ทุนนิยม วงการค้าผักโลกสั่นสะเทือน ข้อเสนอแนวทางรุกและรับของผักไทย ถอดจากบทเรียนของต่างชาติ

2
โลกในอนาคต...(1) ประชากรเพิ่ม พื้นที่เกษตรลด แต่ต้องการอาหารเพิ่ม
ติดต่อสื่อสารรวดเร็ว เศรษฐกิจไร้พรมแดน ศึกษา ทำงาน ค้าขาย ผ่านระบบอินเตอร์เน็ต เทคโนโลยีเปลี่ยนเร็ว พื้นที่เกษตรลด แต่ต้องการอาหารเพิ่ม การแข่งขันสูง ต้องการนวัตกรรมใหม่ๆ สินค้าเฉพาะหลากหลายและรวดเร็ว

3
โลกเปลี่ยนไป...(2) (Mass Customization) สิ่งแวดล้อม
กลยุทธ์ของผลิตภัณฑ์ ผู้บริโภคให้ความสำคัญกับสุขภาพและสิ่งแวดล้อมมากขึ้น การค้าแข่งขันรุนแรงมากขึ้น วัฎจักรอายุของผลิตภัณฑ์ สั้นลง บริหารจัดการธุรกิจแบบใหม่ ข้อตกลงระหว่างประเทศทั้ง กรอบทวิภาคีและพหุภาคี เพิ่มขึ้น เน้นภาพลักษณ์ และ ตลาดที่ชัดเจน (Mass Customization) สินค้าที่แตกต่าง และหลากหลาย ตรงและทัน ความต้องการ ของผู้บริโภค
 สินค้าที่แตกต่าง. และหลากหลาย. ตรงและทัน. ความต้องการ. ของผู้บริโภค.")
4
ผลกระทบต่อเกษตรกรรายย่อย
โลกในอนาคต...(3) ผลกระทบต่อเกษตรกรรายย่อย ลดความสามารถในการแข่งขันและ ลดการพึ่งพาตนเอง ถ้าไม่ปรับตัว...อยู่ลำบาก + เพิ่มโอกาสเรียนรู้/เข้าถึงเทคโนโลยีใหม่ๆ ได้ง่ายและรวดเร็ว + รู้ความต้องการของผู้บริโภค + มีทางเลือกผลิตสินค้าที่หลากหลาย + เพิ่มความเชื่อมโยงจากท้องถิ่น สู่ตลาดโลกโดยตรง
 ผลกระทบต่อเกษตรกรรายย่อย. ลดความสามารถในการแข่งขันและ ลดการพึ่งพาตนเอง. ถ้าไม่ปรับตัว...อยู่ลำบาก. + เพิ่มโอกาสเรียนรู้/เข้าถึงเทคโนโลยีใหม่ๆ ได้ง่ายและรวดเร็ว. + รู้ความต้องการของผู้บริโภค. + มีทางเลือกผลิตสินค้าที่หลากหลาย. + เพิ่มความเชื่อมโยงจากท้องถิ่น สู่ตลาดโลกโดยตรง.")
5
Table Farm Consumers Market Groups? Profit/ Loss Cost Income Yield
Produce Yield Sale Market Farmers Groups? Inputs Cultivars Chemicals Labors Supplies Fertilizers Equipments Environments Technologies Logistic Farm Table

6
การบริโภคและผู้บริโภคผัก
บริโภคเพิ่มขึ้น...ทั่วโลก รายได้เพิ่ม คนในเมืองเพิ่ม นโยบายของ WHO & FAO มีหลากหลายชนิดและลักษณะ อาหาร & ไม่ใช่อาหาร ความต้องการของผู้บริโภคเปลี่ยน เน้นด้านสุขภาพ...คุณค่าทางอาหาร&ป้องกัน/รักษาโรค ปลอดภัย ปลอดสารเคมี (อินทรีย์)คำนึงถึงสิ่งแวดล้อม รูปแบบ... สะดวก รวดเร็ว
คำนึงถึงสิ่งแวดล้อม. รูปแบบ... สะดวก รวดเร็ว.")
7
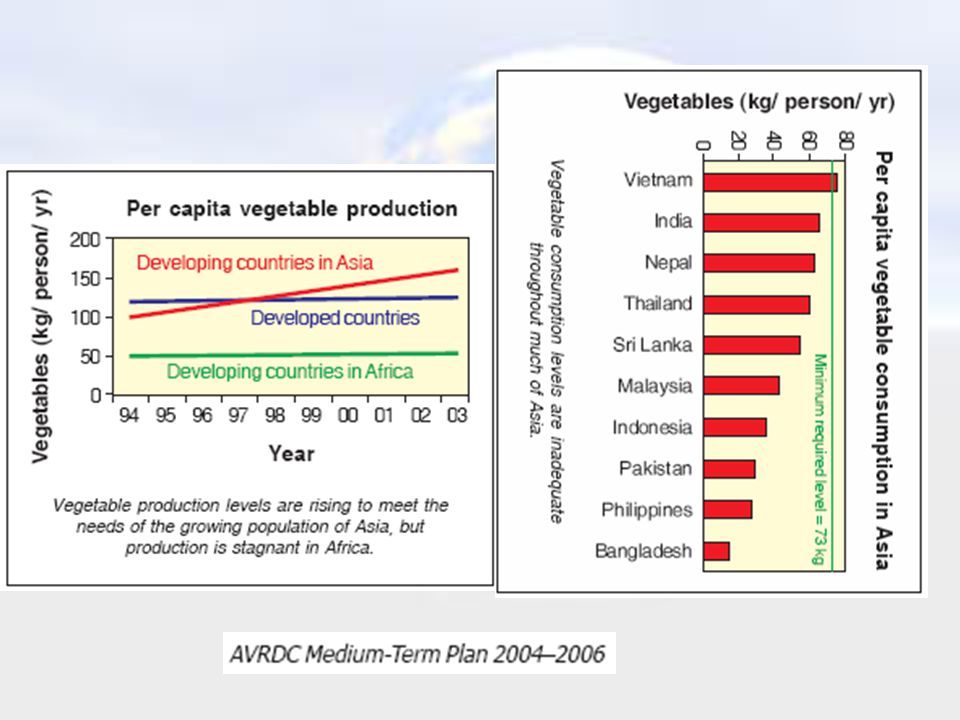
ผักในประเทศที่พัฒนาแล้ว (5) - การบริโภคผัก
FAO’s endeavour to meeting the future needs for horticulture produce; Fruit and Vegetable Initiative Meeting Geneva August 2003

9
“Low fruit and vegetable intake rank in top 10 selected risk factors
FACTS: “Low fruit and vegetable intake rank in top 10 selected risk factors for global mortality” cause ~ 19% of gastrointestinal cancer ~ 31% of ischaemic heart disease and ~ 11% of stroke. Increase fruits and vegetables consumption a global priority…Oct 2003 up to 2.7 million lives could be saved annually

10
USA Red Blue/ Green Purple White A lower risk of some cancers Yellow/
• Urinary tract health • Memory function • Healthy aging • Strong bones and teeth Vision health Green Blue/ Purple USA White A lower risk of some cancers • Heart health • Cholesterol levels Yellow/ Orange Red • Heart health • Vision health • A healthy immune system • Heart health • Memory function • Urinary tract health

11
Bridging Local Potentials with Global Opportunity
Province Region Nationwide Global Social Cohesion International Competitiveness Sufficiency Community Building Cultural Identity Family Value Efficiency Cost effective Productivity Innovation ที่มา: ดร.สุวิทย์ เมฆิษทรีย์ 2547

12
การค้าผักโลก...ผู้เล่นหลัก และปริมาณการเพิ่มขึ้นของประชากรถึงปี 2010
Former Soviet Union 0% EU ASIA จีน ญี่ปุ่น NAFTA Europe 0% North America 5% Asia 51% More than half (51 percent) of global population growth will occur in Asia over the next decade. Most of this population growth will occur in urban centers where personal incomes are rising the fastest. Africa 35% South America 8%
 of global population growth will occur in Asia over the next decade. Most of this population growth will occur in urban centers where personal incomes are rising the fastest. Africa 35% South America 8%")
13
Source:Huang (2004) Global trade patterns in fruit and vegetables
Agriculture and trade report; no. WRS-04-06

15
World Exports of Fresh Vegetables 11-Percent Increase in 2002
Before I begin, how many people are currently involved in international trade? Even if you are not, it is important to learn about international trade because the world is becoming an increasingly global marketplace and trade does affect you (i.e., trade agreements, tariffs, tariff and non-tariff barriers, etc). Also, you may not be aware that you are indirectly exporting if your buyer is the one who is handling the exporting. In 2002, world exports of fresh vegetables reached $21.3 billion, up 4 percent from 2001 and up 10 percent from 1999, according to World Trade Atlas statistics. Before I go any further, I need to explain the definition of fresh vegetables that I am using. I am using the definition as defined under the Harmonized System Chapter #07, which includes fresh, fresh dried, and fresh frozen. The Harmonized System (HS) is a method of classifying products that are traded. In brief, the HS assign codes of up to 10 digits to each item. Codes are internationally harmonized at the 6 digit level. The more complicated the definition, the longer the code. In any case, it is useful to analyze trade data for competitor and market trends. Source: Kosco, S. (2004) World Trade in Fresh Vegetables, USDA/Foreign Agricultural Service Horticultural & Tropical Products Div.
. Also, you may not be aware that you are indirectly exporting if your buyer is the one who is handling the exporting. In 2002, world exports of fresh vegetables reached $21.3 billion, up 4 percent from 2001 and up 10 percent from 1999, according to World Trade Atlas statistics. Before I go any further, I need to explain the definition of fresh vegetables that I am using. I am using the definition as defined under the Harmonized System Chapter #07, which includes fresh, fresh dried, and fresh frozen. The Harmonized System (HS) is a method of classifying products that are traded. In brief, the HS assign codes of up to 10 digits to each item. Codes are internationally harmonized at the 6 digit level. The more complicated the definition, the longer the code. In any case, it is useful to analyze trade data for competitor and market trends. Source: Kosco, S. (2004) World Trade in Fresh Vegetables, USDA/Foreign Agricultural Service Horticultural & Tropical Products Div.")
16
Top Ten World Exporters of Fresh Vegetables
Mexico United States EU (External Trade) China Canada Thailand Turkey India Australia $2,500 $2,000 $1,500 Million Dollars $1,000 $500 Now let’s take a look at our competitors. The world’s top exporters of fresh vegetables include: the Netherlands ($3.7 billion), Spain ($2.7 billion), Mexico ($2.3 billion), the United States ($1.93 billion), and China (almost $1.88 billion). Notice that China’s trend line is the only one that is increasing each year from , while the others are flat or decreasing. China has had impressive growth and almost reached U.S. levels, and it is expected to continue growing. $0 1999 2000 2001 2002 Calendar Years Source: Kosco, S. (2004) World Trade in Fresh Vegetables, USDA/Foreign Agricultural Service Horticultural & Tropical Products Div.
 China. Canada. Thailand. Turkey. India. Australia. $2,500. $2,000. $1,500. Million Dollars. $1,000. $500. Now let’s take a look at our competitors. The world’s top exporters of fresh vegetables include: the Netherlands ($3.7 billion), Spain ($2.7 billion), Mexico ($2.3 billion), the United States ($1.93 billion), and China (almost $1.88 billion). Notice that China’s trend line is the only one that is increasing each year from , while the others are flat or decreasing. China has had impressive growth and almost reached U.S. levels, and it is expected to continue growing. $ Calendar Years. Source: Kosco, S. (2004) World Trade in Fresh Vegetables, USDA/Foreign Agricultural Service Horticultural & Tropical Products Div.")
17
Mexican Exports of Fresh Vegetables United States Absorbs Over 95 Percent
We are skipping the second largest exporter, Spain, because Spain’s trends are similar to the Netherlands. Let’s analyze the third leading vegetable exporter, Mexico. From , exports dropped 3 percent. However, from , exports rose five percent. Mexico relies heavily on the United States as a market, which accounts for about 95 percent of Mexico’s export sales. Source: Kosco, S. (2004) World Trade in Fresh Vegetables, USDA/Foreign Agricultural Service Horticultural & Tropical Products Div.
 World Trade in Fresh Vegetables, USDA/Foreign Agricultural Service Horticultural & Tropical Products Div.")
18
The Netherlands Exports of Fresh Vegetables to Key Markets World’s Leading Fresh Vegetable Exporter
For the next couple of slides, we will take a closer look at the Netherlands’ trends since they are the world’s leading vegetable exporter. Please note that they are not the world’s largest vegetable producer (they are the 28th largest), according to FAO statistics. Having said that, the data shows that in 2002, the Netherlands’ vegetable exports had good solid growth from Exports reached $3.7 billion in 2002, 8 percent above the 2001 figure and 11 percent higher than in 2000. I want to point out that although the world is a global marketplace, we trade most often with our neighbors. This is for many reasons, such as close proximity, similar tastes and preferences, and trade agreements that give preferential tariff treatment to partners. As shown in this slide, Germany is the Netherlands’ top market, followed by the United Kingdom, Belgium, and France (all EU members). However, note that exports to Germany are flat over this 3-year period. In contrast, exports to the United Kingdom, Belgium, and France have been rising and taking up some of this slack. Source: Kosco, S. (2004) World Trade in Fresh Vegetables, USDA/Foreign Agricultural Service Horticultural & Tropical Products Div.
, according to FAO statistics. Having said that, the data shows that in 2002, the Netherlands’ vegetable exports had good solid growth from Exports reached $3.7 billion in 2002, 8 percent above the 2001 figure and 11 percent higher than in I want to point out that although the world is a global marketplace, we trade most often with our neighbors. This is for many reasons, such as close proximity, similar tastes and preferences, and trade agreements that give preferential tariff treatment to partners. As shown in this slide, Germany is the Netherlands’ top market, followed by the United Kingdom, Belgium, and France (all EU members). However, note that exports to Germany are flat over this 3-year period. In contrast, exports to the United Kingdom, Belgium, and France have been rising and taking up some of this slack. Source: Kosco, S. (2004) World Trade in Fresh Vegetables, USDA/Foreign Agricultural Service Horticultural & Tropical Products Div.")
19
Mexican Fresh Vegetable Exports to the United States
In this slide, we can analyze which vegetables Mexico sells to the United States. The United States buys a lot of tomatoes and peppers from Mexico. Tomatoes and peppers account for almost half of the vegetables. Cucumbers, onions, and asparagus are the next largest categories. U.S. vegetable imports from Mexico rose each year from , reaching a record high of $1.8 billion in 2002, 6 percent above the 1999 figure. Source: Kosco, S. (2004) World Trade in Fresh Vegetables, USDA/Foreign Agricultural Service Horticultural & Tropical Products Div.
 World Trade in Fresh Vegetables, USDA/Foreign Agricultural Service Horticultural & Tropical Products Div.")
20
U.S. Exports of Fresh Vegetables Canada Accounts for 60 Percent
In this slide, we can analyze which vegetables Mexico sells to the United States. The United States buys a lot of tomatoes and peppers from Mexico. Tomatoes and peppers account for almost half of the vegetables. Cucumbers, onions, and asparagus are the next largest categories. U.S. vegetable imports from Mexico rose each year from , reaching a record high of $1.8 billion in 2002, 6 percent above the 1999 figure. Source: Kosco, S. (2004) World Trade in Fresh Vegetables, USDA/Foreign Agricultural Service Horticultural & Tropical Products Div.
 World Trade in Fresh Vegetables, USDA/Foreign Agricultural Service Horticultural & Tropical Products Div.")
21
Shares of U.S. Exports of Fresh Vegetables by Value in 2003
None of these categories was dominant. Each accounted for less than 10 percent. This means we are fairly diverse and do not rely on any single crop to export. Source: U.S. Dept. of Commerce, Bureau of the Census

22
U.S. Exports of Fresh Onions, Garlic, & Shallots to Key Markets
Onions/garlic/shallots are the sixth largest U.S. vegetable export. Onions account for most of this category. From , onion exports declined 6 percent. Canada is the top market for U.S. onion exports, followed by Japan and Mexico. Overall, demand for U.S. onions in Canada and Mexico has been increasing over this 4 year period, while exports to Japan have been dropping, due mainly to Japan’s economic crisis, the strong dollar relative to the Yen, and low cost competition from China. In 2002, U.S. onion exports fell 11 percent to $92.7 million. This decline is mainly due to Canada, Japan, and Taiwan, which were down 6 percent, 40 percent, and 30 percent, respectively. However, onion exports to these key markets are expected to recover in From January to October 2003, exports were up 24 percent to Canada, up 42 percent to Japan, and up 61 percent to Taiwan over the same period in Furthermore, from January to October 2003, exports to these three countries are already higher than or at the same level as the entire year in 2002. The United States has a small trade deficit in this category. In 2003, the U.S. garlic industry was rejected for trade assistance under the FAS’s Trade Adjustment Assistance (TAA) because domestic producer prices did not decline by more than 20 percent of the previous 5 year average, a condition required for certifying a petition for TAA. Source: U.S. Dept. of Commerce, Bureau of the Census
 because domestic producer prices did not decline by more than 20 percent of the previous 5 year average, a condition required for certifying a petition for TAA. Source: U.S. Dept. of Commerce, Bureau of the Census.")
23
Top Ten Fresh Vegetable Importers
Now let’s take a closer look at import markets. The United States is the fourth largest vegetable exporter and the world’s largest importer. While the Netherlands, Spain, and Mexico are also key exporters, these countries do not import nearly as much as the United States, as demonstrated in the graph. Five of the eight top markets are EU members. Although the EU is a difficult market to penetrate, it is an important market. Japan’s import market share is dropping rapidly, due to its economic crisis and declining currency against the U.S. dollar. Despite this, Japan is still a very important market. Canada is a strong market and should not be ignored, but it is prudent to develop new market opportunities as well. Source: Global Trade Atlas

24
Japan’s Fresh Vegetable Imports from Top Five Suppliers
$2 billion $1.9 billion $1.7 billion Now we will take a closer look at Japan, the fourth largest vegetable importer at $1.7 billion in Japan is one of our key markets, so it is very helpful if we analyze Japan’s imports from all suppliers from Imports have declined 15 percent over this 3 year period. China supplies over 50 percent of Japan’s vegetable imports, while the United States supplies about 15 percent. China is both an important U.S. market and growing competitor. Source: Global Trade Atlas

25
ข้อมูลตลาดผักญี่ปุ่น

26
ข้อมูลตลาดผักญี่ปุ่น

27
ข้อมูลตลาดผักญี่ปุ่น

28
EU- CAP (Common Agri. Policy)
Common tariff for third countries Common market organization with policy mechanisms and trade agreements to stabilize markets. “ To protect domestic markets and producers’ income while satisfying demand”

29
จีนกับผัก...เมื่อมังกรขยับตัว
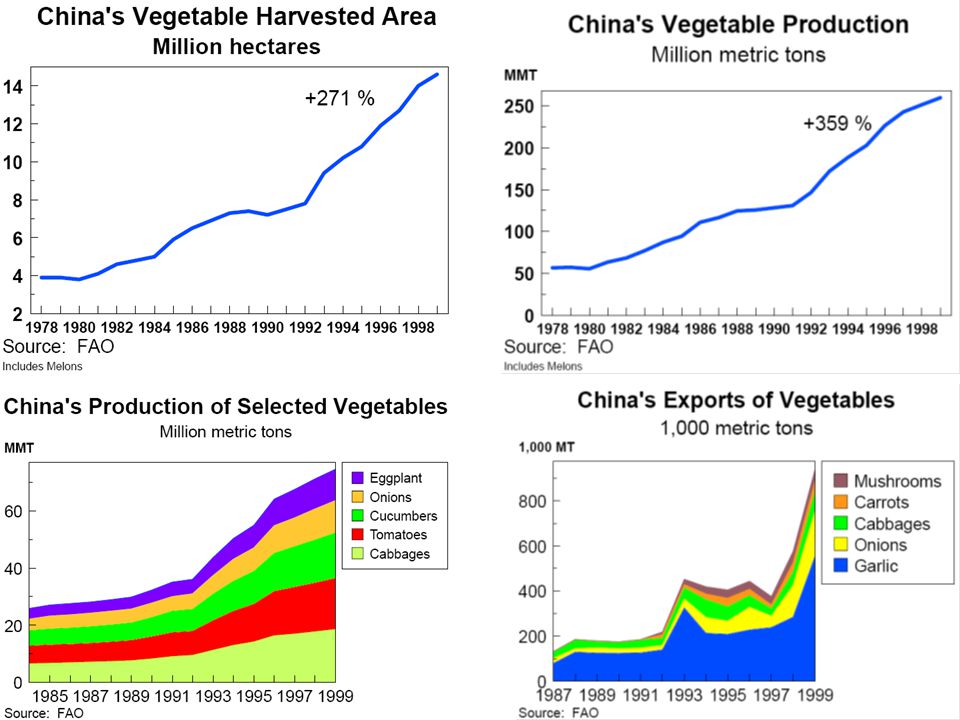
สวนผักจีน...(Yuman et. al 2004) พื้นที่ปลูก 15 ล้านเฮกตาร์ ~ 1/3 ของพื้นที่ของไทย ผลิตในโรงเรือน 1.7 ล้านเฮกตาร์ แรงงานปลูก 78 ล้านคน อีก 80 ล้านคนอยู่ในโรงงานแปรรูปและตลาดผัก ปลูกมากกว่า 40 ชนิด 4 ชนิดหลัก...ขาวปลี แตงร้าน ผักกาดหัว และมะเขือเทศ ระบบการผลิต จากรัฐสู่เอกชน...การลงทุนของต่างชาติ...มาพร้อมกับระบบ ญี่ปุ่น ไต้หวัน สิงค์โปร์ ยุโรปและอเมริกา
 พื้นที่ปลูก 15 ล้านเฮกตาร์ ~ 1/3 ของพื้นที่ของไทย. ผลิตในโรงเรือน 1.7 ล้านเฮกตาร์ แรงงานปลูก 78 ล้านคน อีก 80 ล้านคนอยู่ในโรงงานแปรรูปและตลาดผัก. ปลูกมากกว่า 40 ชนิด. 4 ชนิดหลัก...ขาวปลี แตงร้าน ผักกาดหัว และมะเขือเทศ. ระบบการผลิต จากรัฐสู่เอกชน...การลงทุนของต่างชาติ...มาพร้อมกับระบบ. ญี่ปุ่น ไต้หวัน สิงค์โปร์ ยุโรปและอเมริกา.")
31
จีนกับผัก...เมื่อมังกรขยับตัว
ผลผลิต 400 ล้านตัน ส่งออก ~ 1 %...~ 5 ล้านตัน (2003) ผักสดและแช่แข็ง 50 % ส่งออกหลัก...garlic onion beans นำเข้าเล็กน้อย celery frozen sweet corn คู่ค้ารายใหญ่...Japan, Hong Kong, Korea USA, Netherland
 ผักสดและแช่แข็ง 50 % ส่งออกหลัก...garlic onion beans. นำเข้าเล็กน้อย celery frozen sweet corn. คู่ค้ารายใหญ่...Japan, Hong Kong, Korea USA, Netherland.")
32
จีนกับผัก...เมื่อมังกรขยับ กระเทียมจีน ...สั่นคลอนแหล่งผลิตทั่วโลก
USA : Losing the Garlic War - Cheap Chinese imports put Valley businesses in a bind. “California produces 85% of the nation's garlic supply, while China grows 66% of the world's supply” 2002 garlic acreage in Fresno County ~ 27,210 acres, valued at $131 million. Dehydrated Chinese garlic can sell for 70 cents a pound, while California garlic is $1.25 pound. "We used to sell to Japan and all of sudden we got dropped," Christopher says. "We didn't think anything of it, until Europe dropped us and then Australia. After a while there was no export market left. Little by little, we could see China coming.” Companies were successful in getting the United States to tack a 367% tariff on Chinese fresh garlic. But the flow of garlic only slowed. "We didn't want to be a good-looking corpse wrapped in the American flag." Three products: a Chinese dehydrated product, a blend of American and Chinese and solely American garlic. Source: Rodriguez (2004)
")
33
จีนกับผัก...เมื่อมังกรขยับ กระเทียมจีน ...สั่นคลอนแหล่งผลิตทั่วโลก
India Garlic- export ,282 tonnes. mostly to Bangladesh, Philippines, Singapore, UK, and the US to cater to the ethnic population settled in these countries. - import from China since 1998 to the tune of 15 to 30,000 tonnes. - Poor yielding genotypes, high cost of seeds and its unavailability limits the productivity. - Low productivity and high cost of production Indian farmers are not globally competitive. -Small cloved varieties, with a high number of cloves, are more popular with the Indian consumers. - Export bigger cloved garlic with lesser number of cloves are preferred but the climatic conditions in major garlic growing areas in India is not suitable for the production of such types. Source: Time Agriculture Journal (2003) Pungent Profits
 Pungent Profits")
34
จีนกับผัก...เมื่อมังกรยิ่งขยับ… ? Government program on vegetable safety
The vegetable Basket Project 1st phase …เพิ่มการผลิตผัก ผลสำเร็จ…เพิ่มได้ 3 เท่าตัว ถึง 178 % 2nd phase …เพิ่มความหลากหลายของชนิดผัก …greenhouse technology ในภาคเหนือ …ลงทุน RMB million for vg wholesale markets, logistics facilities, promoting trade, processing and farming integration. …สนับสนุน Anti-risk fund for vg marketing RMB 1 billion (1997) จ่ายดอกเบี้ยค่าก่อสร้างตลาดกลาง และค่าธรรมเนียมจากค่าการตลาดผักในช่วงพิเศษ งานเทศกาลและภัยธรรมชาติ ผลสำเร็จ...ชนิดผักเพิ่มขึ้นจาก 10 ชนิดเป็นมากกว่า 40 ชนิดและหาซื้อผักสดได้ตลอดปี 3rd phase 2002-todate...เป้าปรับปรุงคุณภาพและความปลอดภัย ของผัก เน้นการบังคับใช้ The action plan for Pollution-free Agricultural products Source: Yuman et. al, The vegetable industry in China.
 จ่ายดอกเบี้ยค่าก่อสร้างตลาดกลาง และค่าธรรมเนียมจากค่าการตลาดผักในช่วงพิเศษ งานเทศกาลและภัยธรรมชาติ ผลสำเร็จ...ชนิดผักเพิ่มขึ้นจาก 10 ชนิดเป็นมากกว่า 40 ชนิดและหาซื้อผักสดได้ตลอดปี 3rd phase 2002-todate...เป้าปรับปรุงคุณภาพและความปลอดภัย. ของผัก เน้นการบังคับใช้ The action plan for Pollution-free. Agricultural products. Source: Yuman et. al, The vegetable industry in China.")
35
จีนกับผัก...เมื่อมังกรยิ่งขยับ… ? Government program on vegetable safety
Supervising and controlling vg production: - establishing a number of export production bases, standardized production demonstrationareas and pollution-free production bases; - strictly controlling the pollution from industrial wastes and urban garbage and agrochemical residues to vegetable production environments; - strictly controlling agri-inputs markets and applications of agrochemicals; - standardizing vegetable production and marketing, including production, grading,packaging, storing and transportation; - organizing producers, buyers and sellers into associations such as producer's associations, marketing associations, cooperatives, etc. Source: Yuman et. al, The vegetable industry in China.

36
จีนกับผัก...เมื่อมังกรยิ่งขยับ… ? Government program on vegetable safety
Establishing and completing a market access system: - setting up a monitoring and inspection system to monitor and test the production environments, inputs and safety status; - adopting and rapidly applying testing technology that can be used to check the agrochemical residue status at production bases, wholesale markets and retail markets; - establishing special areas/counters in wholesale markets and supermarkets for pollution-free products, green products and organic products; - implementing product labelling and tracing systems. Source: Yuman et. al, The vegetable industry in China.

37
จีนกับผัก...เมื่อมังกรยิ่งขยับ… ? Government program on vegetable safety
Completing the support system, i.e.: - further developing the legal system, - completing the standardizing system, - completing the testing and inspecting system, - establishing a certification system, - intensifying the research and extension system, - constructing an information network, for training and publicity purposes. Source: Yuman et. al, The vegetable industry in China.

38
ข้อเสนอแนวทางรุกและรับของผักไทย ถอดจากบทเรียนของต่างชาติ
จีนกับผัก...เมื่อมังกรยิ่งขยับ… ? Government program on vegetable safety ข้อเสนอแนวทางรุกและรับของผักไทย ถอดจากบทเรียนของต่างชาติ Source: Yuman et. al, The vegetable industry in China.

39
GLOBALISATION Emergence of mega global food companies, supermarkets, and food service companies. Emergence of mega global brands. Increasing freedom of world trade means product purchased from cheapest source. (Major buyers have global sourcing strategies). Linked and closed global supply chains. Emergence of large, efficient, strategically located production plants ( increasingly in Asia) to supply global markets. Relatively strong $AUD favours imports and reduces export options. Highly mobile capital. Growing affluence and ‘Westernisation’ of Asia. Source: McKinna, The Australian vegetable industry at the cross roads
. Linked and closed global supply chains. Emergence of large, efficient, strategically located production plants ( increasingly in Asia) to supply global markets. Relatively strong $AUD favours imports and reduces export options. Highly mobile capital. Growing affluence and ‘Westernisation’ of Asia. Source: McKinna, The Australian vegetable industry at the cross roads.")
40
THE REALITIES OF GLOBALISATION
The food business is rapidly becoming seamlessly globalised. Supplier margins being eroded. With WTO and various bilateral FTAs, markets are rapidly being opened up. Exclusion of competitors on bio-security grounds is becoming very difficult. Australia faces strong competition from new emerging competitors with significantly lower labour costs eg. China, South Africa, South America, Thailand. For the above reasons, Australia is rapidly being squeezed out of traditional markets. Source: McKinna, The Australian vegetable industry at the cross roads

41
THE REALITIES OF GLOBALISATION cont’d
To the extent that it can compete, it is because of a seasonal window of opportunity where no one else can supply, or some other point of difference (eg. superior quality). Seasonal advantages are reducing and so too is the quality gap. Global competition is now starting to strongly effect the domestic market. Both Coles and Woolworths have buying offices in Asia. The key message is, that in order to survive, we must be able to compete globally. Companies must reduce costs to globally benchmark or have a point of difference sufficient to support premium pricing. Source: McKinna, The Australian vegetable industry at the cross roads
. Seasonal advantages are reducing and so too is the quality gap. Global competition is now starting to strongly effect the domestic market. Both Coles and Woolworths have buying offices in Asia. The key message is, that in order to survive, we must be able to compete globally. Companies must reduce costs to globally benchmark or have a point of difference sufficient to support premium pricing. Source: McKinna, The Australian vegetable industry at the cross roads.")
42
THE REALITIES OF GLOBALISATION cont’d
To the extent that it can compete, it is because of a seasonal window of opportunity where no one else can supply, or some other point of difference (eg. superior quality). Seasonal advantages are reducing and so too is the quality gap. Global competition is now starting to strongly effect the domestic market. Both Coles and Woolworths have buying offices in Asia. The key message is, that in order to survive, we must be able to compete globally. Companies must reduce costs to globally benchmark or have a point of difference sufficient to support premium pricing. Source: McKinna, The Australian vegetable industry at the cross roads
. Seasonal advantages are reducing and so too is the quality gap. Global competition is now starting to strongly effect the domestic market. Both Coles and Woolworths have buying offices in Asia. The key message is, that in order to survive, we must be able to compete globally. Companies must reduce costs to globally benchmark or have a point of difference sufficient to support premium pricing. Source: McKinna, The Australian vegetable industry at the cross roads.")
43
AUSTRALIA’S COMPETITIVE GLOBAL POSITION
Australian horticulture is being squeezed out of its traditional markets. Australia is a minute player in world horticulture production and trading (less than 3%). Australia can’t survive in commodity trading except for short term, spot market opportunities. Australia’s only chance to compete in global markets with vegetables is through niche marketing, product differentiation, premium quality product and technology transfer. Source: McKinna, The Australian vegetable industry at the cross roads
. Australia can’t survive in commodity trading except for short term, spot market opportunities. Australia’s only chance to compete in global markets with vegetables is through niche marketing, product differentiation, premium quality product and technology transfer. Source: McKinna, The Australian vegetable industry at the cross roads.")
44
CHINA China is a growth powerhouse on a scale most Australians cannot comprehend. Many peasants displaced by the 3 rivers dam have been redeployed in government sponsored agriculture. Tend to produce in large, collective farms or with government sponsored foreign joint venture partners. Massive, large scale plantings of horticulture occurring. Quickly improving on poor track record regarding product quality and safety. Farmers becoming more educated - this generation are university graduates. Learning about branding. The vast size of the continent means China has many climatic production zones. Source: McKinna, The Australian vegetable industry at the cross roads

45
CHINA cont’d In Malaysia, China has taken over 50% market share from Australia. Freight daily into Hong Kong market where they are up to 20 times cheaper than Australia. In Singapore, Chinese produce is around half the price of Australian. Although Australian product is still seen to be superior, the price disparity is too great to sustain a premium. Aggressive competitor willing to use predatory pricing to gain market access. Major investment via govt or foreign joint ventures. Highly responsive to customer needs and willing to produce to detailed specifications. Has a great advantage low labour costs allowing value adding eg. trimming, sorting, pre-packing etc. Source: McKinna, The Australian vegetable industry at the cross roads

46
CRITICAL SUCCESS FACTORS FOR AUSTRALIA IN AGRI-FOOD
Cost reduction - continuous improvement. Innovation - products and processing. Critical mass and economies of scale. Market/customer focus - Marketing 101. Market segmentation. Product differentiation. Critical mass issues at every level of supply chain. Market intelligence. Tight specializations. Source: McKinna, The Australian vegetable industry at the cross roads

47
WHERE WILL THE INDUSTRY BE IN 2010?
Majority of commodity vegetables and vegetable products will be imported - potatoes, peas, beans. Water intensive, low value products will be uncompetitive eg potatoes. Processing industry will move offshore. Strong domestic focus. Growth in categories where Australia has a comparative advantage - beetroot, corn, onions. Growth of large corporate and family business farms with: economies of scale state of the art technology IP/PBR best practice management systems. Source: McKinna, The Australian vegetable industry at the cross roads

48
WHERE WILL THE INDUSTRY BE IN 2010? contd:
Australian corporates will move part of their production offshore. Growth of value added (pan ready veg, salads, fresh soups, etc) through strategic alliances between marketing and distribution companies (eg. Harvest Fresh), and large corporate growers. Continual growth of organic and minimum chemical vegetables. Supermarkets will control 80% of the retail market. Central wholesale markets will continue to become less important. Further consolidation in global food service sectors. Australia will be an exporter of technology eg. PBR mini-tuber potatoes. Source: McKinna, The Australian vegetable industry at the cross roads
 through strategic alliances between marketing and distribution companies (eg. Harvest Fresh), and large corporate growers. Continual growth of organic and minimum chemical vegetables. Supermarkets will control 80% of the retail market. Central wholesale markets will continue to become less important. Further consolidation in global food service sectors. Australia will be an exporter of technology eg. PBR mini-tuber potatoes. Source: McKinna, The Australian vegetable industry at the cross roads.")
49
GROWERS’ SHARE OF THE FOOD $ IS DECLINING
Power of supermarkets and food service operators increasing. Increasing share of food is processed and value added. Growers’ sector isn’t participating further along the supply chain. Growers not delivering to consumers, expectations: - taste - nutrition - convenience - value for money. Under investment in market development, branding and promotion. Failure to embrace the proven principles on consumer focus, market segmentation/niche markets, and product differentiation. Source: McKinna, The Australian vegetable industry at the cross roads

50
HARMONISATION OF PRODUCT INTEGRITY SYSTEMS
Global supermarkets driving product integrity - Due diligence requirements. Seamless whole of supply chain system. HACCP. SQF. Codex. Eurepgap. Fresh Care. Red Tractor/BRC. Globalisation of European supermarkets is making EU standards a global standard. Source: McKinna, The Australian vegetable industry at the cross roads

51
THE AGENDA FOR AUSTRALIAN VEGETABLE INDUSTRIES
Cost reduction, particularly labour. 2. Delivering consumer satisfaction: - genetics - value adding - packaging - branding - fitness for purpose selection and labeling Product differentiation/innovation: - taste/enjoyment - nutrition - functionality - convenience - microwavable, semi-prepared - value for money Source: McKinna, The Australian vegetable industry at the cross roads

52
THE AGENDA FOR AUSTRALIAN VEGETABLE INDUSTRIES contd:
Market segmentation/ niche marketing/ market development. Reduce chemical usage - move towards quasi-organics. Product integrity and quality schemes. Build supply chain partnerships. Category management. Origin labeling. Source: McKinna, The Australian vegetable industry at the cross roads

53
NZ-CHINA We do have the advantage of a temperate climate whereas China is hampered by its continental climate where it has no shoulder seasons as we know them. We can take advantage of the UK, EU and US based supermarkets buying patterns and preferences in China coupled with their exponential growth in the next decade or so. We do need to retain our links with New Zealand Trade and Enterprise and their knowledgeable and experienced staff, both here and in China to provide the best information possible to our growers.. Source:CHINA: THE TIGER AWAKENS Report of a Study and Visit by the Federations to Hong Kong, Guangdong and Shandong Provinces, China and the Asia Fruit Congress 2004, Shanghai.

54
NZ-CHINA Opportunities for NZ Produce Industry in China:
• We can produce the fruit and vegetables, including the specialty produce for the high-end niche markets that the wealthier Chinese people will want to buy in the future. • We have the varieties, and also the climate, and possibly more importantly, the knowledge and expertise amongst our growers to provide the varieties that China will be seeking for its niche markets. • We also have the people, in particular amongst our next generation of growers, to continue our uniqueness here in New Zealand but also to take our Intellectual Property (IP) to China. • We do have a counter seasonal advantage. Source:CHINA: THE TIGER AWAKENS Report of a Study and Visit by the Federations to Hong Kong, Guangdong and Shandong Provinces, China and the Asia Fruit Congress 2004, Shanghai.
 to China. • We do have a counter seasonal advantage. Source:CHINA: THE TIGER AWAKENS Report of a Study and Visit by the Federations to Hong Kong, Guangdong and Shandong Provinces, China and the Asia Fruit Congress 2004, Shanghai.")
55
ร่วมเป้าหมายกระจายภารกิจ...
เราผ่านยุคล่าเมืองขึ้นมาแล้ว... แต่ศึกทุนนิยมครั้งนี้ใหญ่หลวงนัก... แล้วเรา...จะสู้เขาอย่างไร? ร่วมเป้าหมายกระจายภารกิจ... พลังฝ่ามือที่ใช้ทุกนิ้ว... ลดลักษณะศิลปินเดี่ยว...ทั้งคนและสถาบันให้ได้ คิดแบบยุทธวิธีหมวก 6 ใบ คิดด้วย พูดด้วยและทำด้วย ไม่ใช่ NATO สุดยอดวิทยายุทธ...ทุกอย่างเป็นอาวุธ

งานนำเสนอที่คล้ายกัน

 ในช่วงยุค Internet เพิ่ง เริ่มต้น เป็นบริษัทที่ดำเนินงานทางด้าน.>")


